Figure 2.

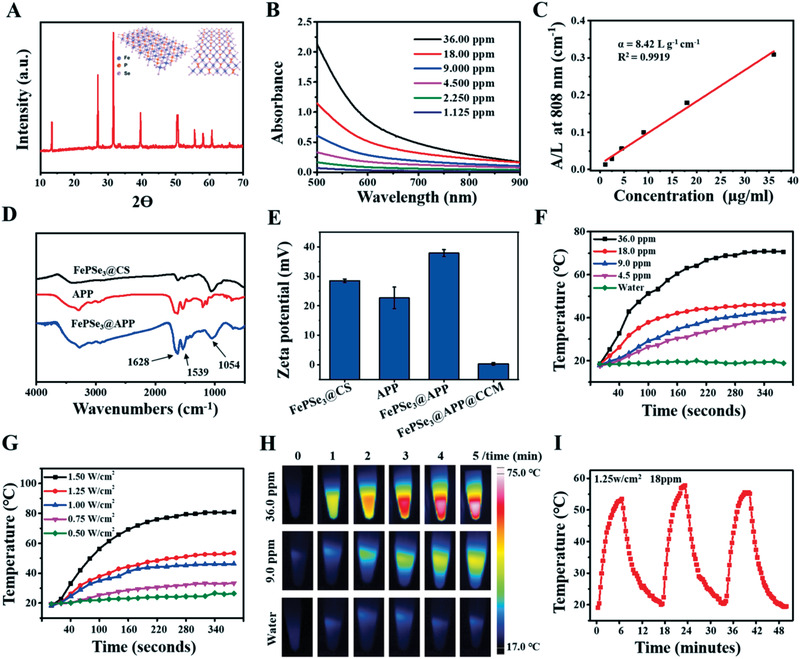
A) XRD spectra and schematic structure of ultrathin FePSe3@CS NSs. B) Absorbance spectra of FePSe3@CS NSs at varied concentrations. C) Normalized absorbance intensity at λ = 808 nm divided by the characteristic length of the cell (A/L) at varied concentrations. D) FT‐IR spectra of FePSe3@CS NSs, APP, and FePSe3@APP NSs. E) The zeta potential of APP and these NSs. The temperature curves of FePSe3@CS NSs at F) various concentrations and G) varied power densities. H) Typical pictures of thermal imaging. I) Temperature curve of FePSe3@CS NSs for three on/off cycles under 808 nm laser irradiation.
