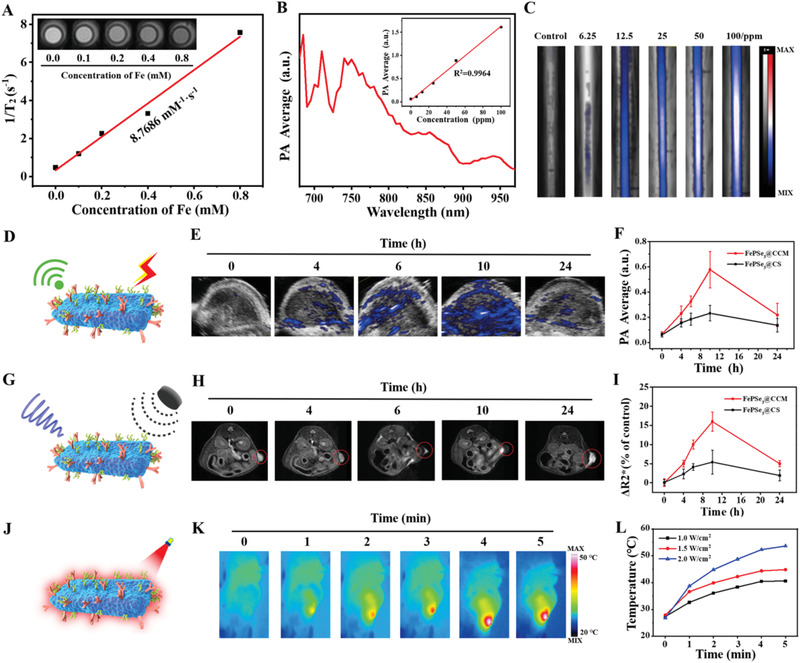
Figure 3.

A) T2‐weighted MR images and fitted curve of the T2‐weighted relaxation rates (r 2) of FePSe3@CS NSs with different Fe concentrations ranging from 0.10 × 10⁻³ to 0.80 × 10⁻³ m under 1.5 T magnetic field. B,C) PA spectrum, PA values, and the corresponding PA images of FePSe3@CS NSs with different concentrations ranging from 6.25 to 100 ppm. D) Schematic illustration for PAI ability, E) PAI of FePSe3@CCM NSs in the tumor site, and F) the corresponding PA value after i.v. injection with FePSe3@CCM NSs and FePSe3@CS NSs at different time intervals. G) Schematic illustration for MRI ability, H) T2‐weighted MR images of FePSe3@CCM NSs in the tumor site, and I) the ΔR 2 * value in the tumor site after i.v. injection with FePSe3@CCM NSs and FePSe3@CS NSs at different time intervals. J) Schematic illustration for thermal imaging, K) thermal imaging in the tumor site, and L) the corresponding temperature curves with FePSe3@CCM NSs i.v. injection after 10 h at different power densities.
