
Figure 4.
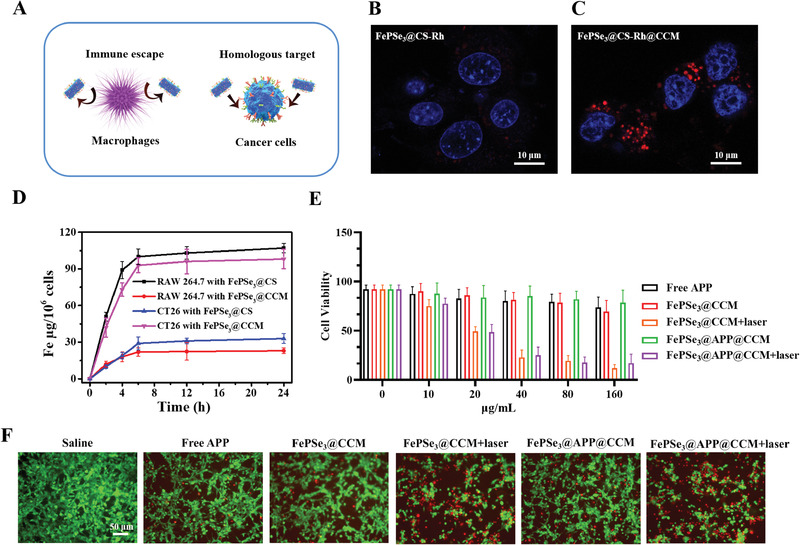
A) Schematic illustration for immune escape and homologous targeting ability of FePSe3@CCM NSs. B,C) CLSM images of CT26 cells after incubation with FePSe3@CS‐Rh and FePSe3@CS‐Rh@CCM NSs for 6 h; scale bar: 10 µm. D) Quantitative analysis of cellular uptake of CT26 and RAW 264.7 cells under different conditions. E) Cell viability of CT26 cancer cells incubated with diverse concentrations of free APP, FePSe3@CCM, and FePSe3@APP@CCM. For the FePSe3@CCM and FePSe3@APP@CCM groups, the cells were irradiated with or without an NIR laser (808 nm, 1.5 W cm−2, 5 min) after 6 h incubation, followed by further incubation for 18 h. F) Fluorescent images of CT26 cells stained with calcein AM (green) and PI (red) after different treatments; scale bar: 50 µm.