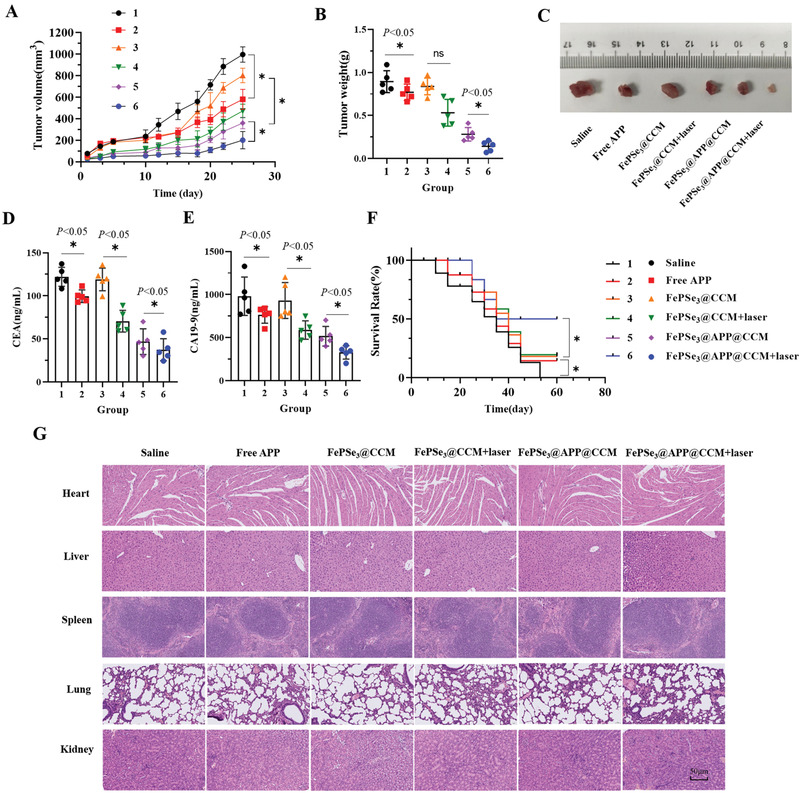
Figure 6.

A) Tumor growth curve and B) tumor weight of the tumor‐bearing mice from the different treatment groups (1: control; 2: free APP; 3: FePSe3@CCM; 4: FePSe3@CCM plus laser irradiation; 5: FePSe3@APP@CCM; 6: FePSe3@APP@CCM plus laser irradiation). C) Tumor tissues removed from mice after different treatment groups. D,E) Expression of tumor markers CEA and CA19‐9 in the mouse blood serum. F) Survival curve of tumor‐bearing mice treated by different groups. G) Pathological changes detected by H&E staining of the main organs (heart, liver, spleen, lung, and kidney) from mice after receiving intravenous injection with different treatment groups for 25 days. Scale bar: 50 µm (n = 5, mean ± SD; * p < 0.05 and ns = no significance).
