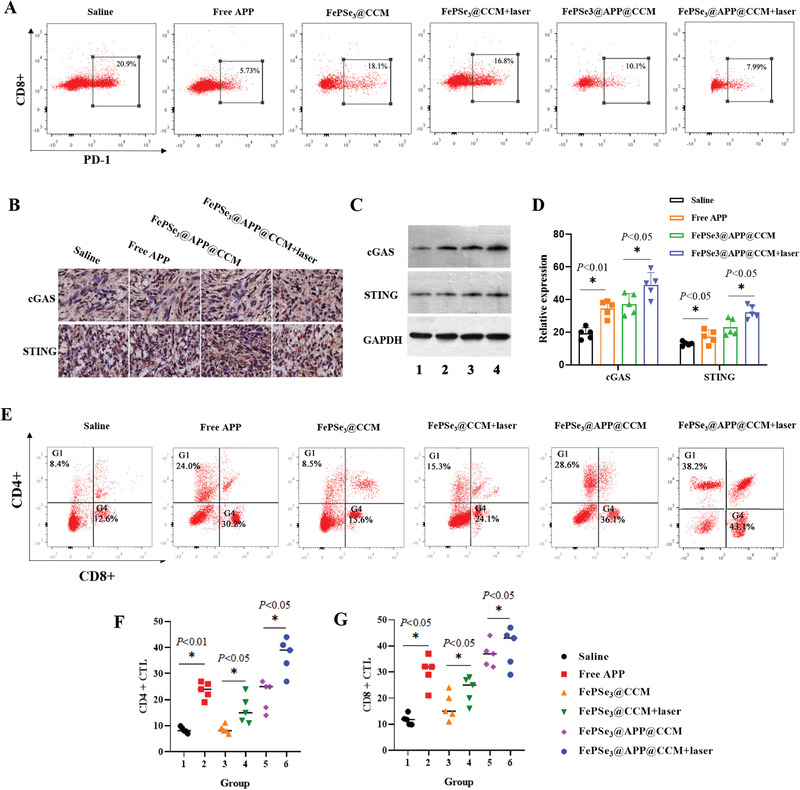
Figure 7.

A) Flow cytometric quantification of PD‐1 expression on splenic lymphocytes isolated from CT26 tumor‐bearing C57BL/6J mice treated with different groups (1: control; 2: free APP; 3: FePSe3@CCM; 4: FePSe3@CCM + laser irradiation; 5: FePSe3@APP@CCM; 6: FePSe3@APP@CCM + laser irradiation). Expression of the cGAS–STING signaling pathway in tumor sites assayed by B) immunohistochemistry and C) western blots. D) Statistical chart of the protein expression of cGAS and STING. E) Flow cytometry showing different groups of activated CD4+ and CD8+ CTLs in splenic lymphocytes. F,G) Statistical chart of CD4+ and CD8+ CTLs based on flow cytometry image data in (E) from different treatment groups in vivo (n = 5, mean ± SD; * p < 0.05 and ns = no significance).
