
Figure 2.
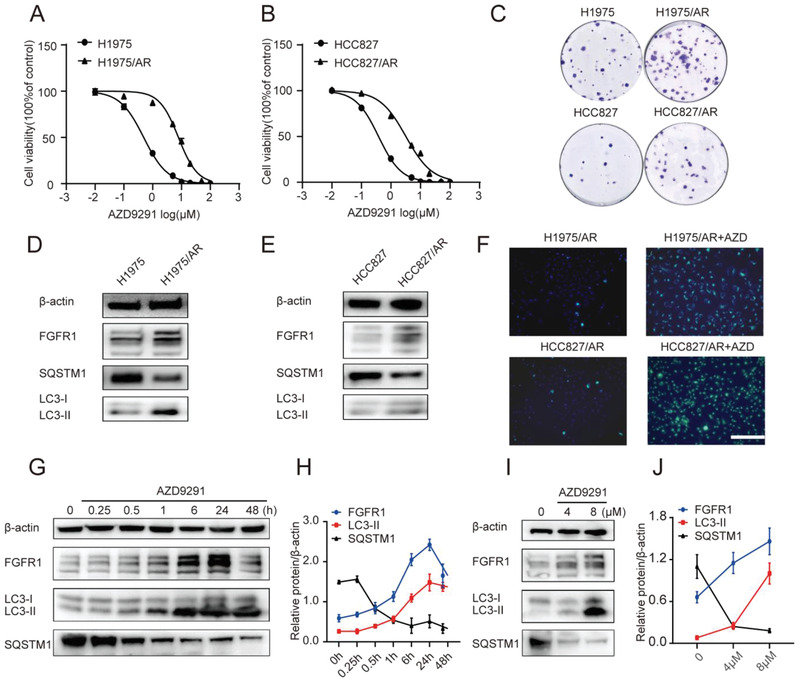
The increased level of autophagy and FGFR1 expression in AZD9291‐resistant cells with or without AZD9291. A,B) Acquisition of H1975 and HCC827 cells resistant to AZD9291. The drug sensitivity of parental and AZD9291‐resistant cells was detected by CCK8 assay. IC50 analysis was performed using GraphPad analysis software. C) Representative colonies of parental and AZD9291‐resistant cells treated with AZD9291 for 48 h before clonogenic assay. D,E) Western blotting showing the expression levels of FGFR1 and autophagy‐related protein in parental and AZD9291 resistant cells. F) Autophagy was monitored based on MDC staining 48 h post‐AZD9291 treatment. Scale bar: 100 µm. G–J) Western blotting showing increase level of FGFR1 and LC3‐II, decrease level of SQSTM1 in H1975/AR cells treated with AZD9291 during the increasing time course (G,H) or with increasing concentrations (I,J). Quantitative grayscale intensity of protein expression was performed using ImageJ software. Values were normalized to ß‐actin protein levels. All data were from three repeats. IC50: half maximal inhibitory concentration.