
Figure 8.
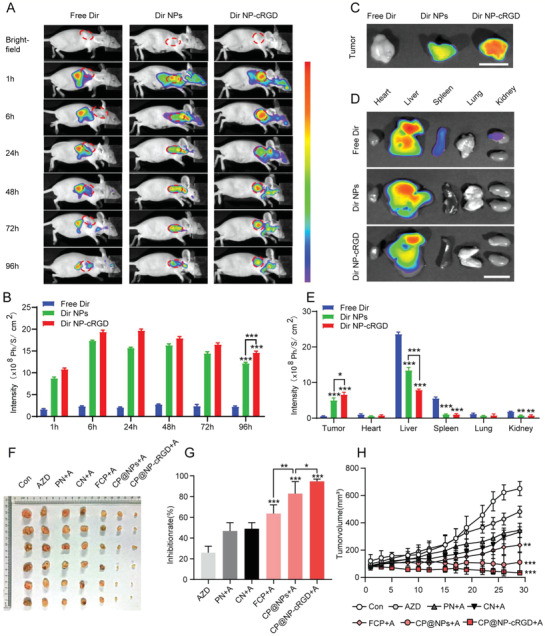
Activity and antitumor efficiency of CP@NP‐cRGD in AZD9291‐resistant NSCLC in vivo. A) In vivo distribution of free Dir, Dir NPs, and Dir NP‐cRGD in H1975/AR tumor‐bearing mice after intravenous injection for 1, 6, 24, 48, 72, and 96 h (n = 3). B) Quantitative average fluorescent intensities. C) Ex vivo fluorescence images of the dissected NSCLC tumors and D) normal organs 96 h after administration. Scale bar: 1 cm. E) Average fluorescent intensities. F) Images of AZD9291‐resistance subcutaneous xenograft tumors at the end of treatment. G) Tumor inhibition ratio and H) tumor growth curves of AZD9291‐resistant tumors during the treatment. All data were from three repeats, *p < 0.05, **p < 0.01, ***p < 0.001. A: AZD9291, PN: PD@NP‐cRGD, CN: CQ@NP‐cRGD, FCP: free chloroquine and PD173074.