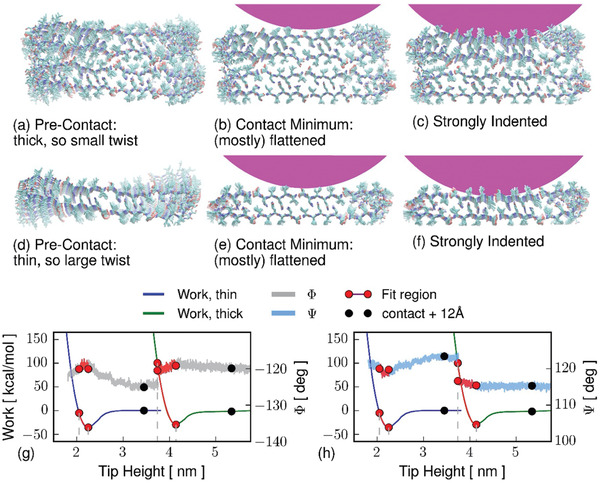
Figure 6.

Atomistic simulation of indentation of a–c) thick and d–f) thin amyloid models. Due to the smaller aspect ratio, the thicker system is less twisted at initial contact, and so has less opportunity to relax under indentation. The equilibrium work is shown as smooth curves on the left axes, the same data is repeated on (g, h) for separate comparison against each Ramachandran angle. Averages of each Ramachandran angles were taken over the 120 residues nearest to the AFM tip center (g:Φ angle, h:Ψ). Circles correspond to images in part (a–f) and also to Ramachandran histograms in Figure 7. Pink circle caps indicate the tip; direction of indentation is down the page; the fibril axis points out of the page.
