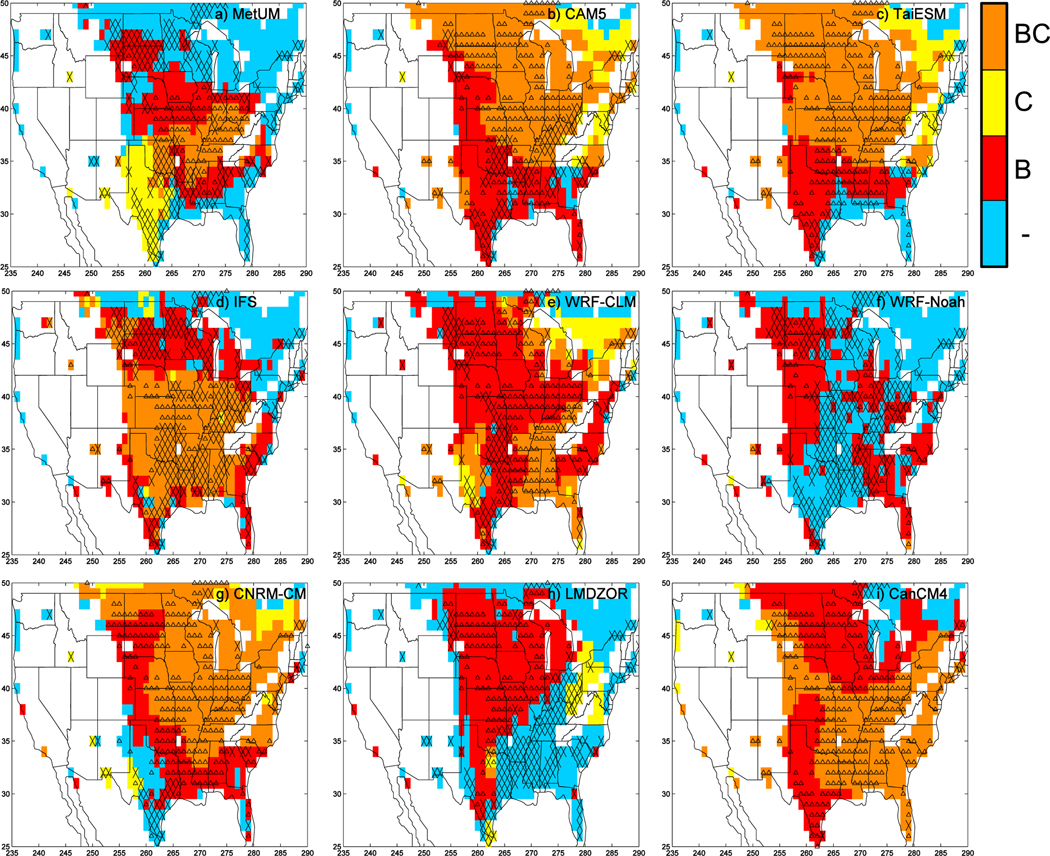
Figure 13.
Maps of locations with statistically significant day 2 to day 5 mean bias (red, B on the color scale), with statistically significant change from day 2 mean to day 5 mean (yellow, C on the color scale), and with both (orange, BC on the color scale). Blue regions have no significant mean bias or bias change but a reliable observation of 2 m temperature. White regions are where the temperature reconstruction is unreliable. Black symbols indicate where the European Centre Re-Analyses used to initialize the models is itself biased. If the models are significantly warmer than ERA-Interim at 00Z, the symbol is an upward pointing triangle; if they are not, it is a cross. (a) Met Office Unified Model (MetUM), (b) Community Atmosphere Model version 5.1 (CAM5), (c) Taiwan Earth System Model (TaiESM), (d) Integrated Forecast System (IFS), (e) Weather Research and Forecasting-Community Land Model (WRF-CLM), (f ) WRF-Noah, (g) Centre National de Recherches Météorologiques-climate model (CNRM-CM), (h) Laboratoire de Météorologie Dynamique Zoom coupled to ORCHIDEE (LMDZOR), (i) Canadian Climate Model version 4 (CanCM4). Data are from April to August.

