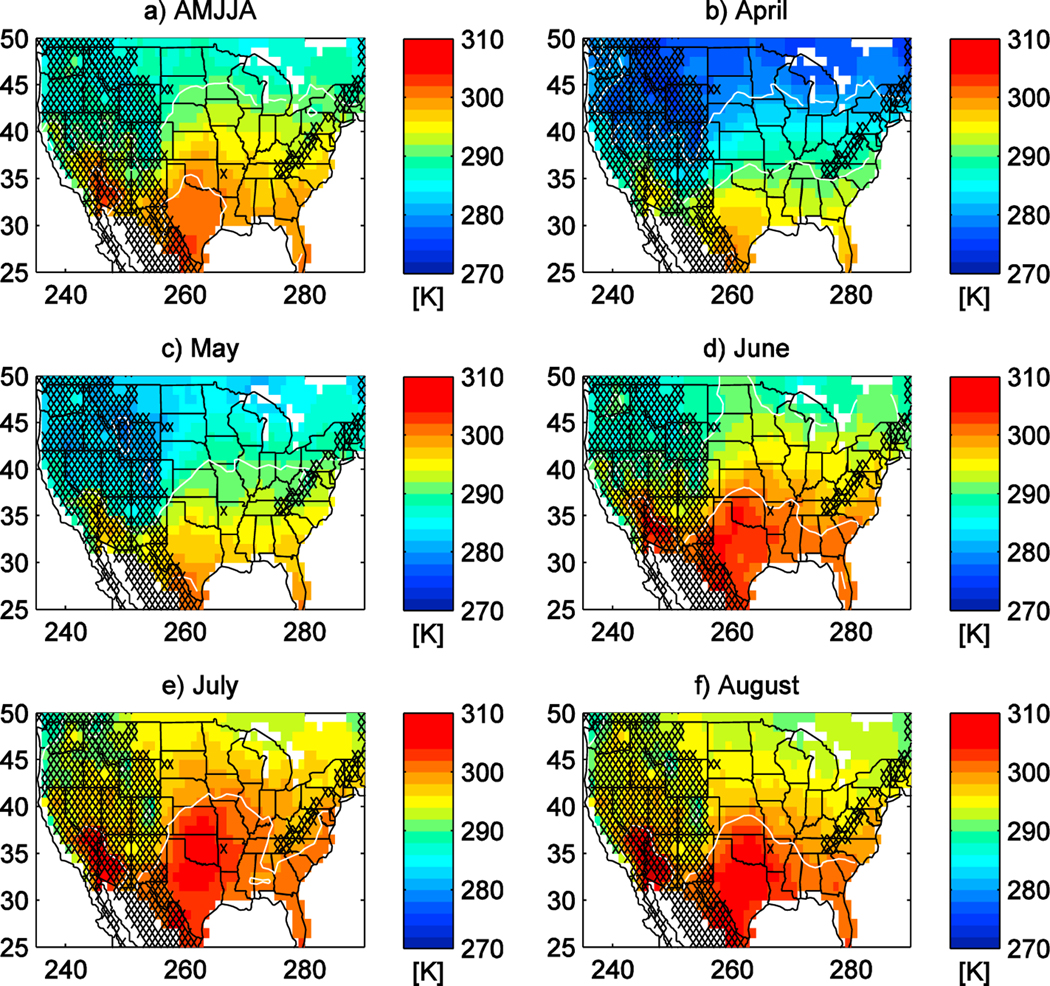
Figure 2.

Maps of time mean T2M from the data set produced by interpolating National Oceanic and Atmospheric Administration quality-controlled local climatological data onto a 1° by 1° grid. (a) The 5 month mean for April-August (AMJJA) 2011, (b) April, (c) May, (d) June, (e) July, (f) August. White contours are isotherms every 10 K. Regions where the reconstruction is unreliable due to highly variable topography are hatched.
