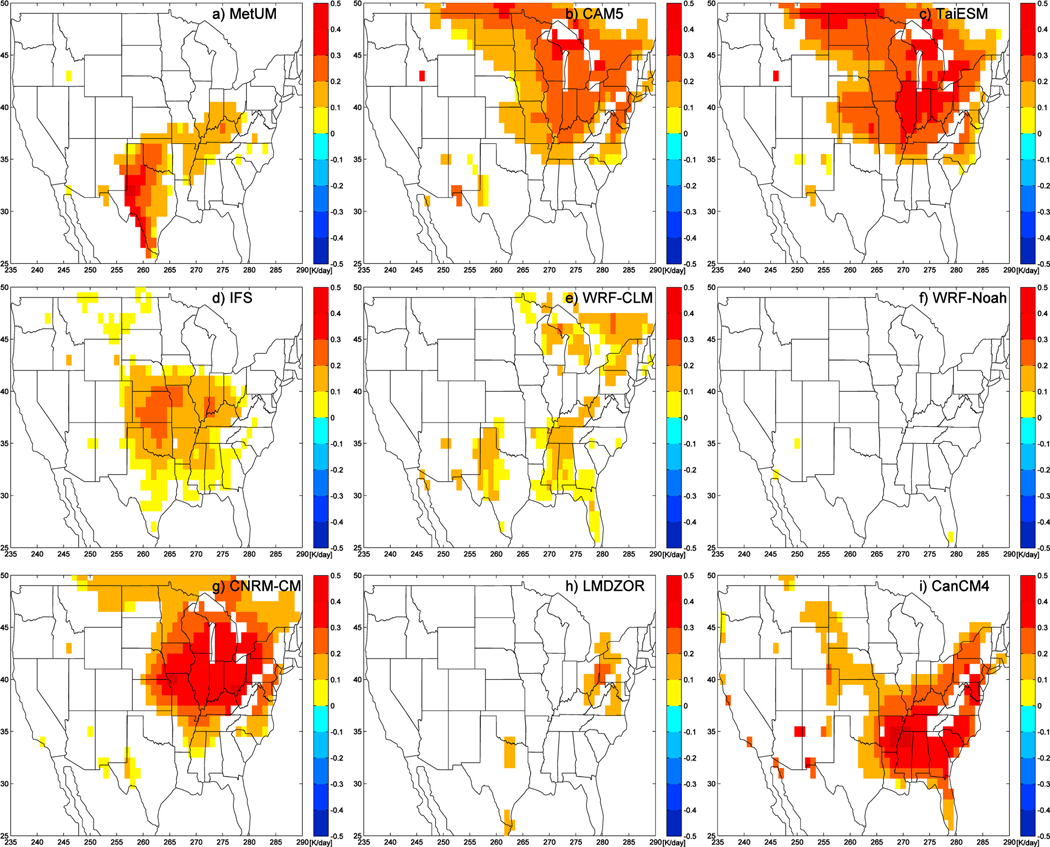
Figure 8.
Maps of April-to-August mean 2 m temperature error change, from day 2 mean to day 5 mean, expressed as a rate in K d−1 (where there is significant difference between the day 2 and day 5 means, using a paired t test at the 95% confidence level). (a) Met Office Unified Model (MetUM), (b) Community Atmosphere Model version 5.1 (CAM5), (c) Taiwan Earth System Model (TaiESM), (d) Integrated Forecast System (IFS), (e) Weather Research and Forecasting-Community Land Model (WRF-CLM), (f) WRF-Noah, (g) Centre National de Recherches Météorologiques-climate model (CNRM-CM), (h) Laboratoire de Météorologie Dynamique Zoom coupled to ORCHIDEE (LMDZOR), (i) Canadian Climate Model version 4 (CanCM4).

