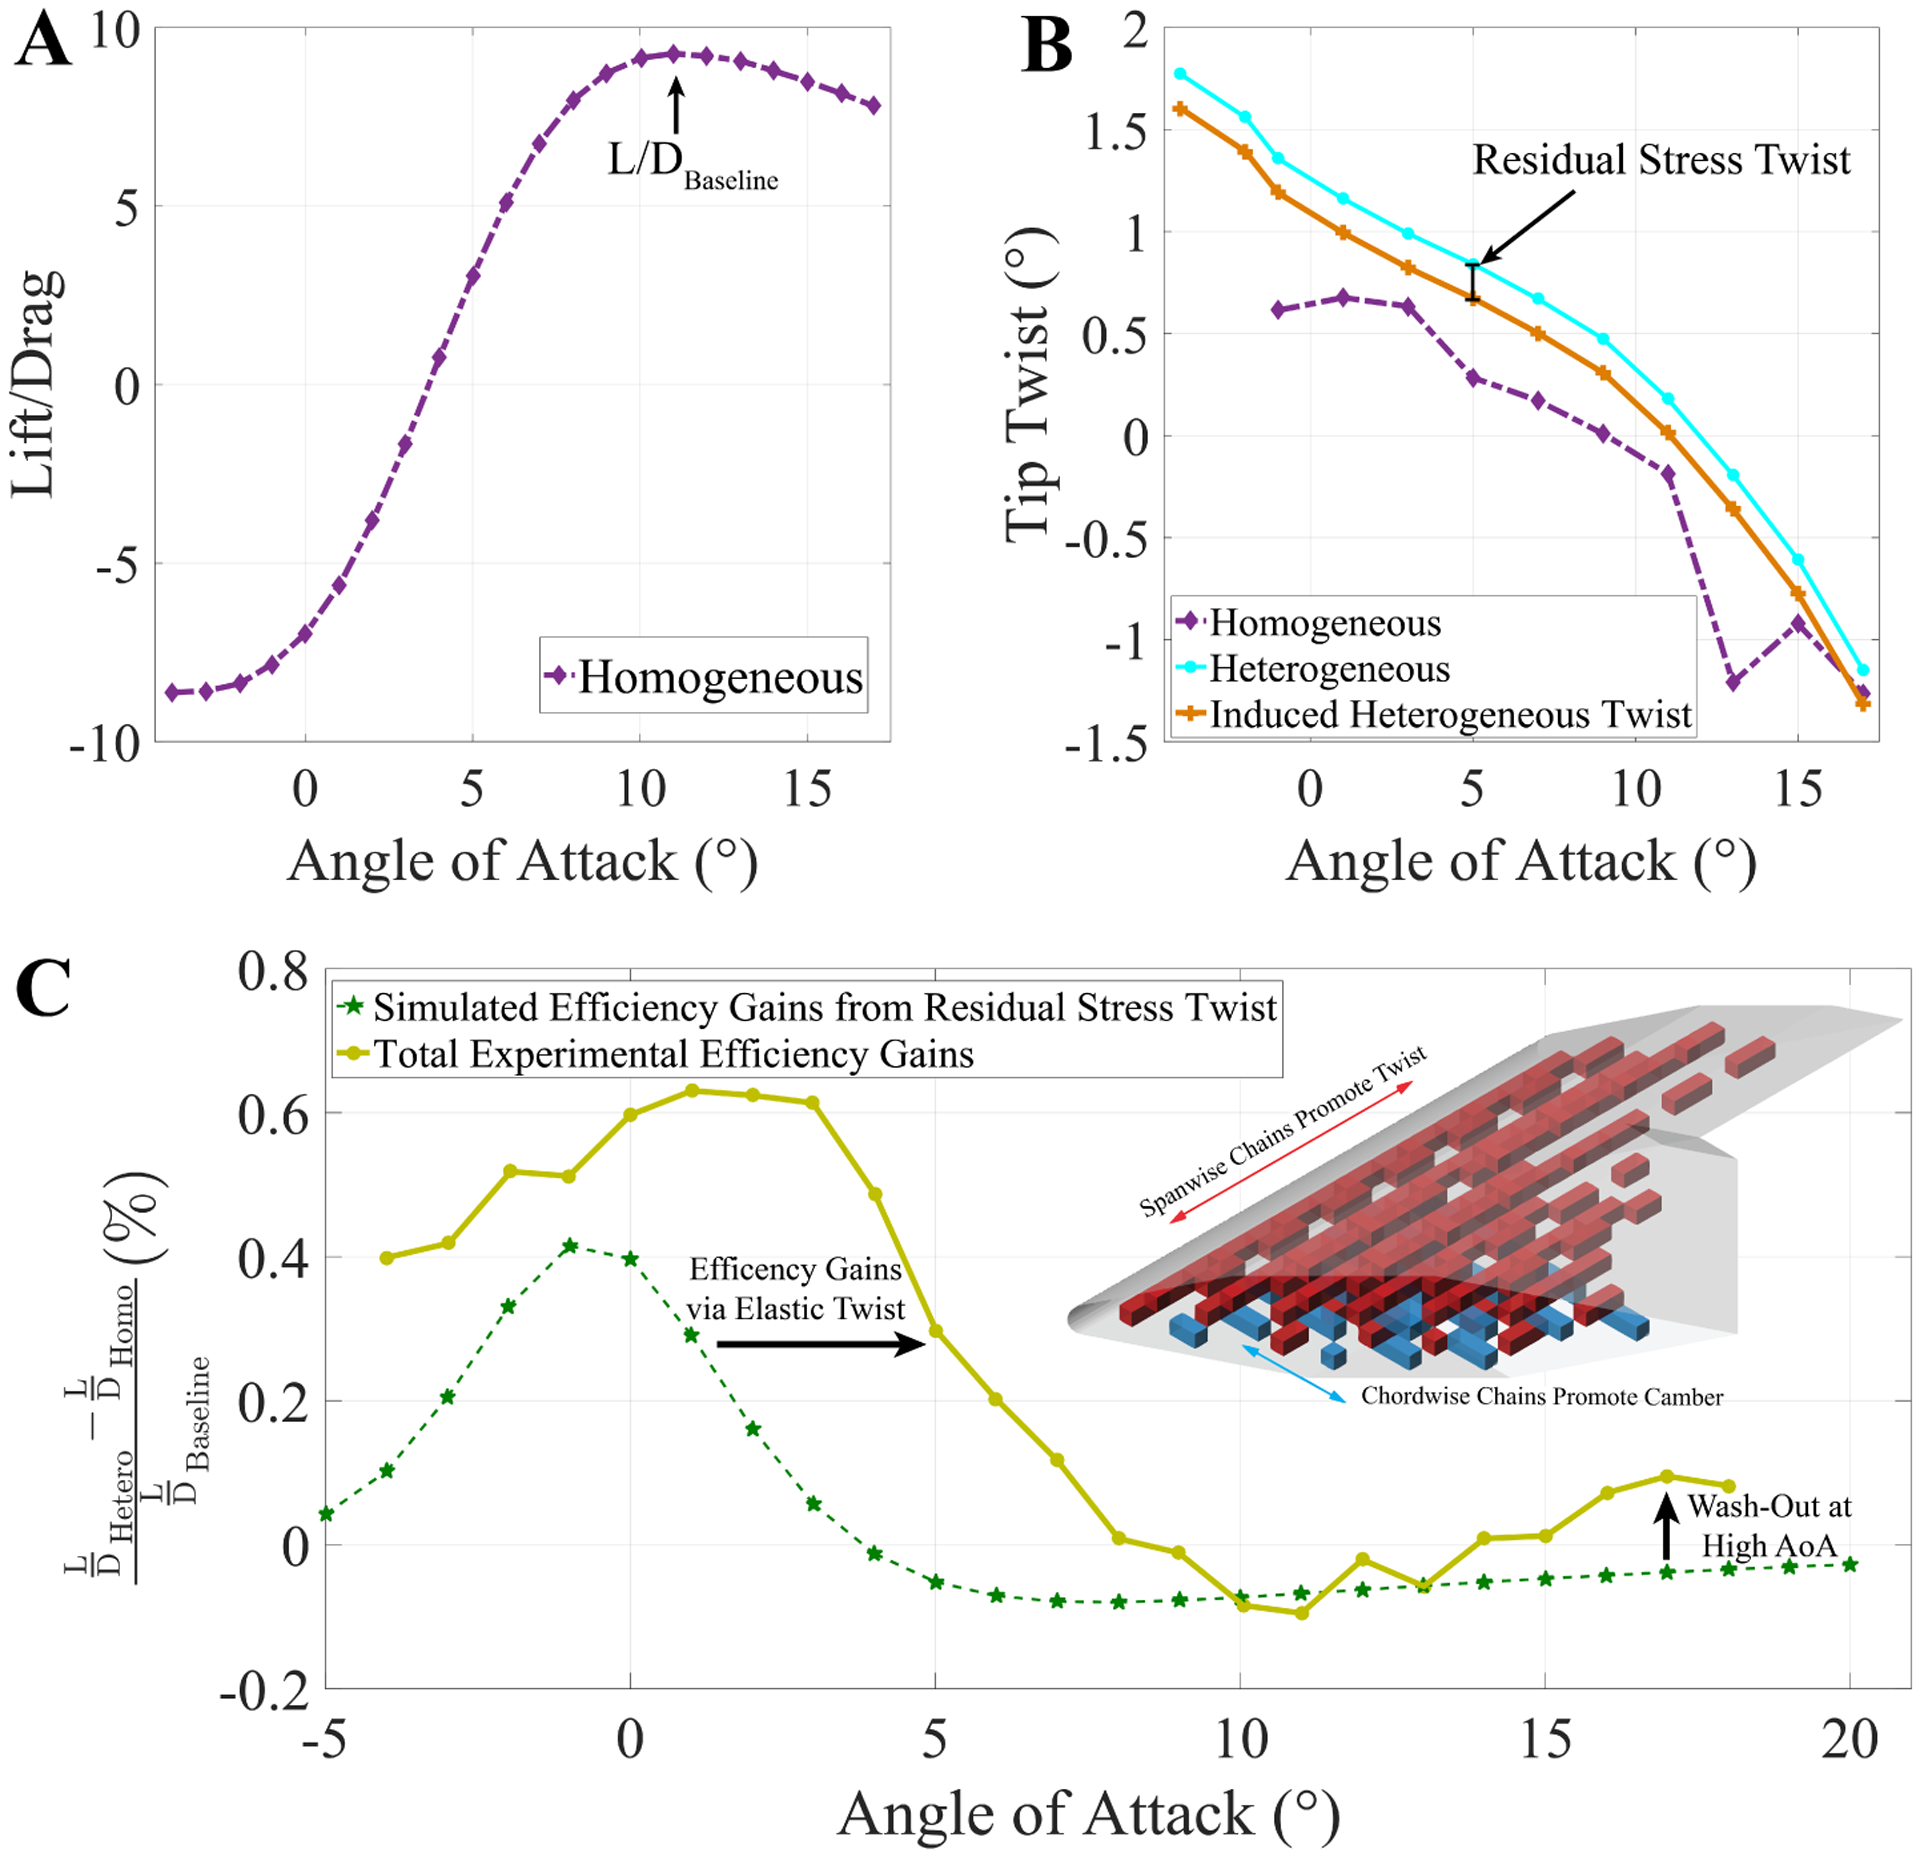
Figure 8:

The lift to drag ratio for the baseline homogeneous wing is shown. A) Lift-Drag curve of the homogeneous design and highlighting the defined baseline operation value. B) compares the twist between the baseline homogeneous and programmed heterogeneous models as well as the estimated tip twist of the programmed heterogeneous model due to the change in stiffness. C) compares the total efficiency gains to the gains through the initial residual stress induced shape change, as well as the tuned changes in stiffness due to the programmed heterogeneous building block placement, shown in the right-hand corner of Figure C.
