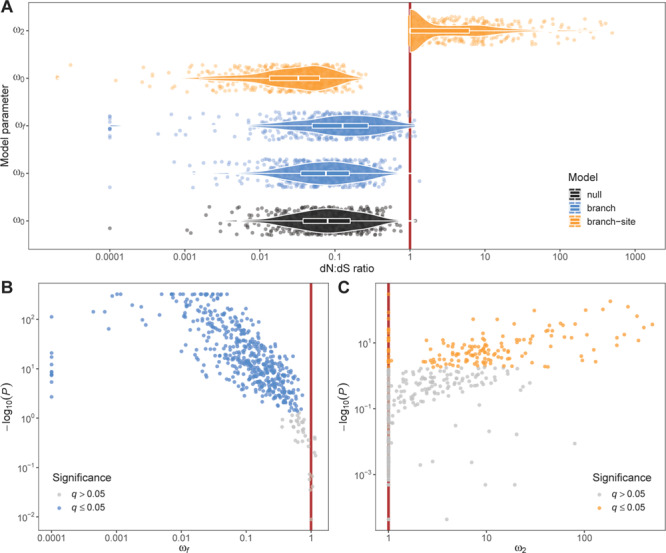
Figure 2.

Ratios of non-synonymous versus synonymous nucleotide substitution rates (dN:dS ratios; ω) in 532 genes estimated from codon evolution models in PAML. (A) baseline estimates for whole alignments from null models (ω0), estimates for foreground (cetacea; ωf) and background (all others; ωb) branches from branch models, and estimates for codons under purifying (ω0) and positive (ω2) selection in foreground branch (cetacea) from branch-site models. (B) Foreground dN:dS ratio (ωf) and statistical significance (P value) from likelihood-ratio tests between free-ratio branch models and neutral branch models. Significant tests after FDR correction (q ≤ 0.05) are highlighted in blue. (C) Foreground dN:dS ratio of positively selected codons (ω2) and statistical significance (P value) from likelihood-ratio tests between positive-selection branch-site models and neutral branch-site models. Significant tests after FDR correction (q ≤ 0.05) are highlighted in orange. The red solid lines in all plots represent neutral evolution (ω = 1).
