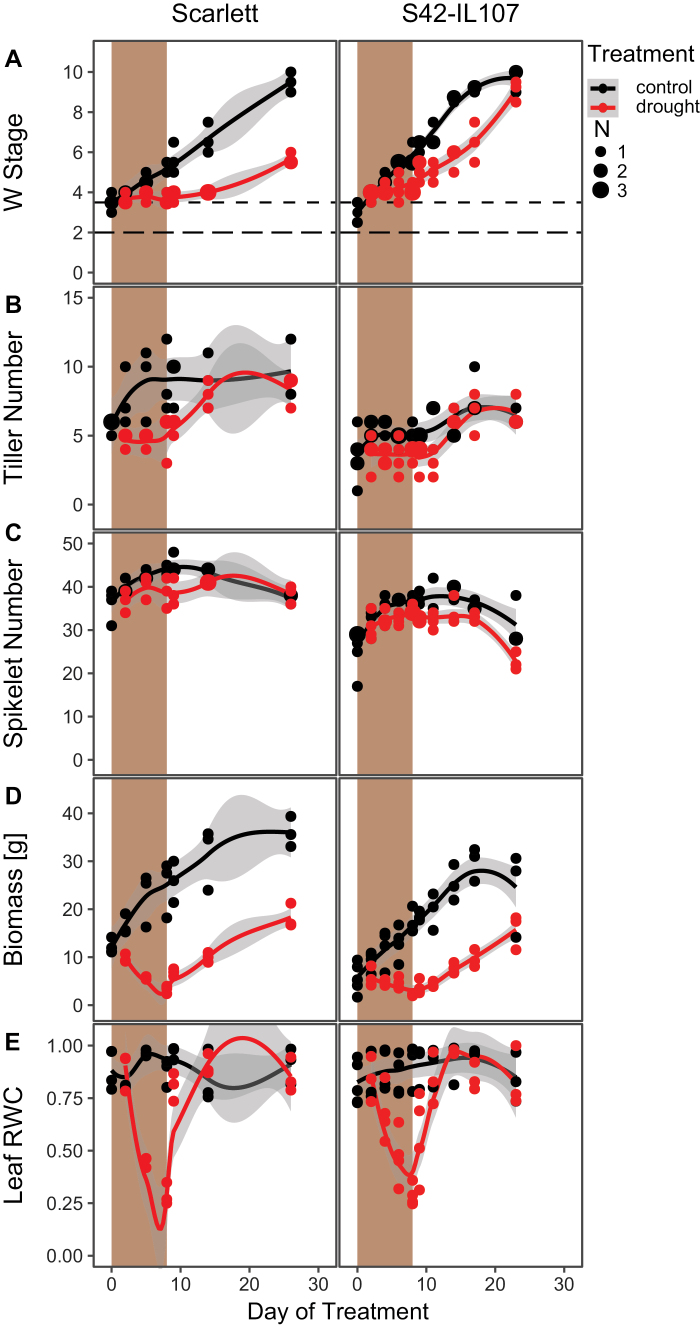
Fig. 4.
Severe drought delays MSA development in barley. MSA development (A), the number of tillers (B), the number of spikelets (C), fresh weight biomass (D), and leaf RWC (E) were scored under control (black) and severe drought (red) conditions and during recovery. Shaded areas indicate the period during which plants were not watered. Dot sizes indicate the number of overlapping samples. Trend lines were calculated using a polynomial regression (Loess smooth line), grey areas show the 95% confidence interval.

