Fig. 1.
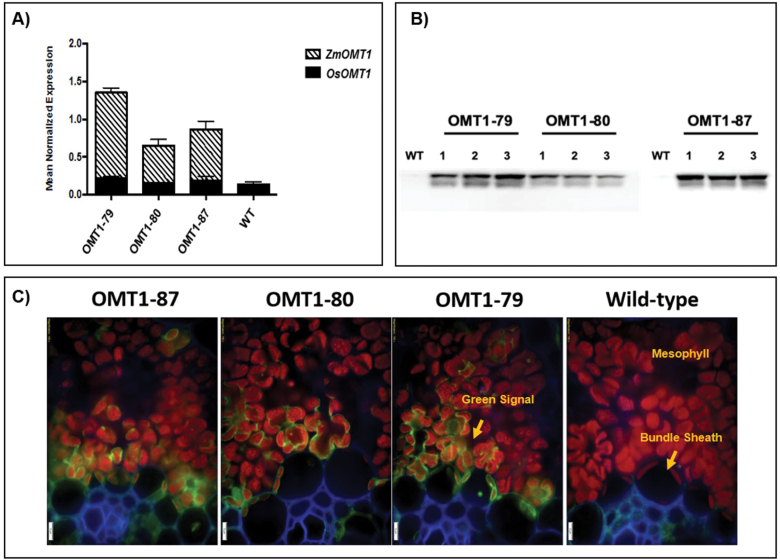
Transcript accumulation of OsOMT1 and ZmOMT1 genes detected by qRT-PCR analysis on leaf blades of transgenic rice OMT1 lines (OMT1-79, OMT1-80, and OMT1-87). Wild-type plants (WT) served as a control. Data represent the mean normalized expression ±SEM of three and two biological and technical replicates, respectively (A). Assessment of expressed ZmOMT1 protein in transgenic lines (OMT1-79, OMT1-80, and OMT1-87) together with WT rice as a control via western blot using 12% SDS–PAGE and two-step antibody immunodetection with 5 s exposure time. The calculated molecular mass of OMT1-AcV5 is ~60 kDa; however, 40 kDa is the size shown on the blot. Samples were loaded based on equal leaf area of 0.396 cm2 (B). Immunolocalization of ZmOMT1-AcV5 protein in leaves of WT, OMT1-79, OMT1-80, and OMT1-87 plants in which the green signal is easiest to see in line OMT1-79 where the levels are highest. Anti-AcV5 tag primary antibody diluted 1:25 plus Alexa Fluor 488 (fluorescent dye) goat anti-mouse IgG secondary antibody diluted 1:200 was used to probe for the AcV5 tag (shown in green color). Chlorophylls are shown as a red autofluorescence. The cell wall was co-stained with calcofluor white and is shown in blue. Magnification: ×200. Scale bar: 5 µm (C).

