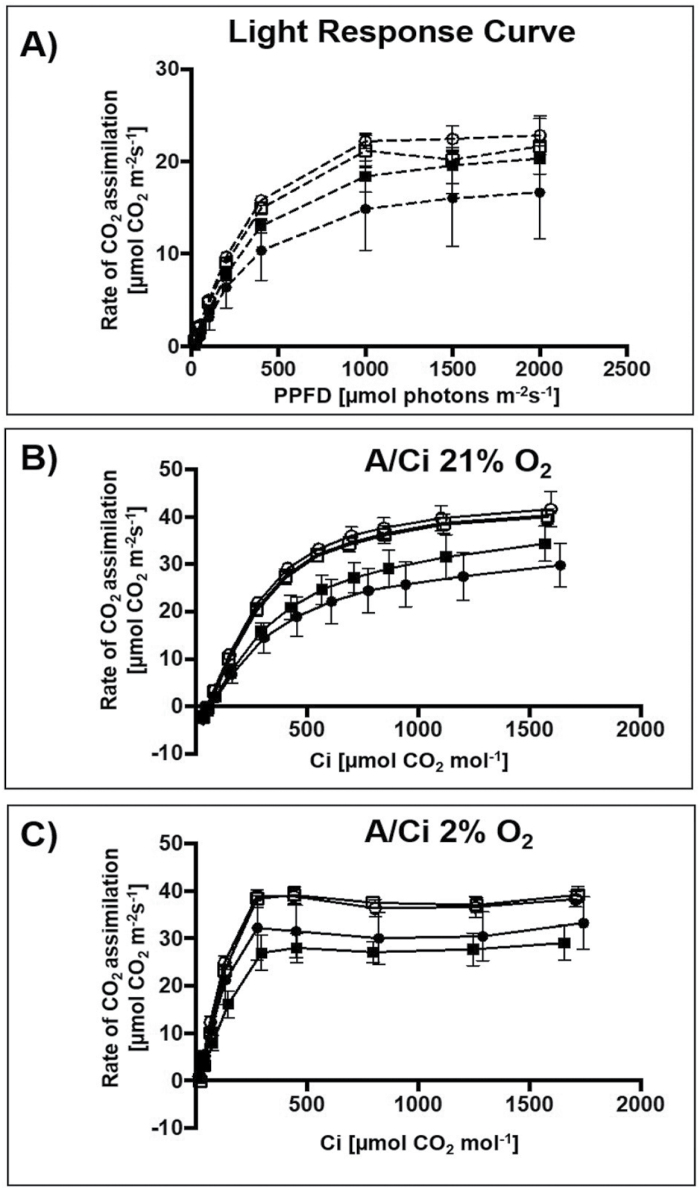
Fig. 4.
Rate of CO2 assimilation (A) in response to photosynthetic photon flux density (PPFD). Light–response curve measurements were carried out under 400 µmol CO2 mol−1 and leaf temperature of 30 °C. Values represent the mean ±SEM of two leaves of four individual T4 plants of OMT1 lines (OMT1-79, OMT1-80, and OMT1-87) and wild-type rice (WT) (A). Rate of CO2 assimilation in response to intercellular CO2 concentration (Ci) at 21% (B) and 2% O2 (C). The measurements were carried out under a light intensity of 2000 µmol photons m−2 s−1 at a leaf temperature of 30 °C. Values represent the mean ±SEM of two leaves of four individual T4 plants of OMT1 lines (OMT1-79, black square; OMT1-80, white square; and OMT1-87, black circle) and WT rice, white circle.

