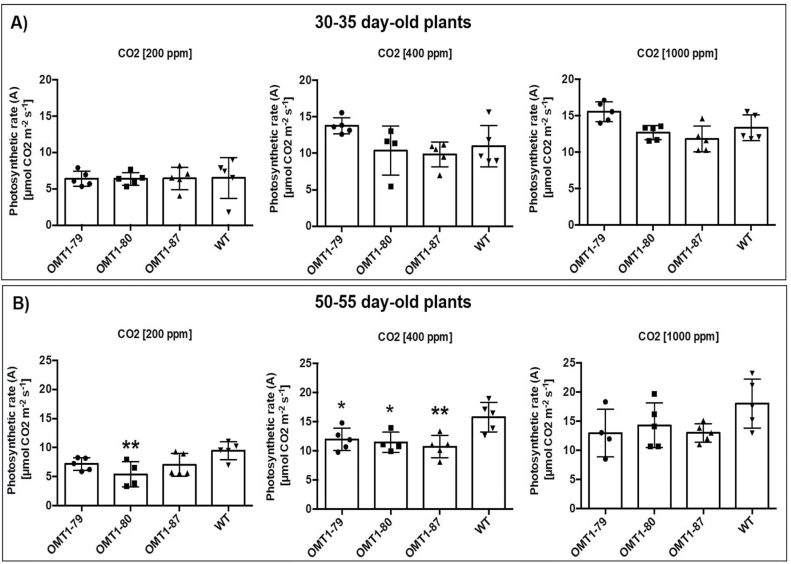
Fig. 6.
Impact of three CO2 concentrations (200, 400, and 1000 µmol CO2 mol−1) on the rate of CO2 assimilation (A) measured inside a custom gas exchange cuvette of two different plants sets [OMT1 lines (OMT1-79, OMT1-80, and OMT1-87) and the wild type (WT)]; younger, 30–35 d old (A) and older, 50–55 d old (B). For both experiments, the youngest, fully expanded leaf was chosen for each treatment. Values represent the mean ±SEM, n=4–5. Significant differences from the WT are indicated by *P≤0.05 and **P≤0.01, Tukey’s multiple comparison test.

