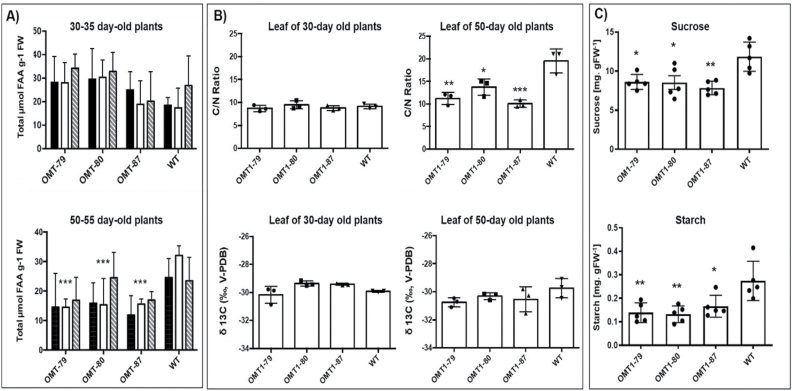
Fig. 8.
Absolute amounts of total free amino acid (FAA) content (A), and the C:N ratio and δ 13C value (B) of OMT1 lines (OMT1-79, OMT1-80, and OMT1-87) and wild-type (WT) rice. (A) Samples collected under different CO2 concentrations [µmol CO2 mol−1] (200, black; 400, white; and 1000, dashed pattern). Values represent the mean ±SEM, n=5. (B) Samples collected from 30- and 50-day-old OMT1 lines and WT rice. Values represent the mean ±SEM, n=3. Significant differences from the WT are indicated by *P≤0.05, **P≤0.01, and ***P≤0. 001, Tukey’s multiple comparison test

