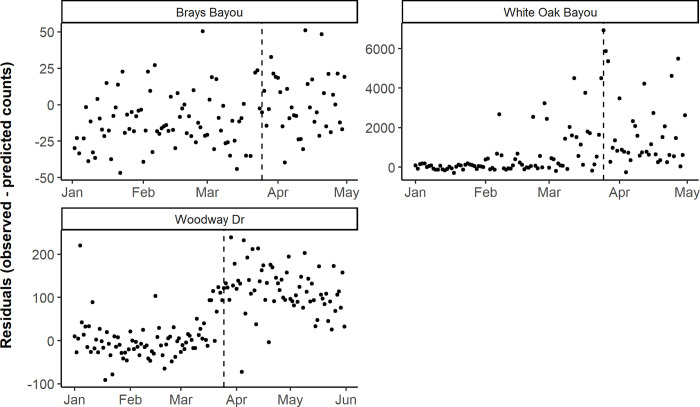
Fig 3. Daily observed minus predicted pedestrian counts by counter location, before and during the Stay Home order in Houston.
The vertical dashed line corresponds to the Stay Home order on March 24, 2020 in Harris County, Texas. Note the y-axis scales vary between plots to facilitate the interpretation of results.

