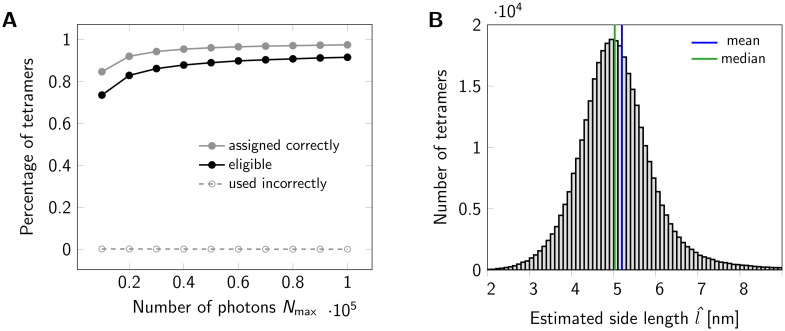
Fig 2. Statistics for a set of oligomers.
(A) Assignment of localizations to individual dye molecules. The maximum number of photons Nmax emitted from a fluorophore was varied from 10000 to 100000. The gray line indicates the percentage of tetramers, for which all localizations were assigned to the correct dye molecule. A tetramer was considered eligible for further analysis, if its localizations were assigned into four groups. The black line shows the percentage of eligible tetramers. For each data point a data set of 500000 tetramers (side length 5 nm) was simulated. (B) Histogram of estimated tetramer side length for a data set of 500000 tetramers with nominal side length of 5 nm. Localizations were assigned to individual dye molecules. A total number of 367328 tetramers were eligible and further analyzed. For circle fitting, term (10) was minimized. For side length estimation we used Eq (39). Analysis of the histogram yields a mean of 5.1959 nm (blue line) and a median of 5.0256 nm (green line). Values larger than 9 nm were cut off for display only.

