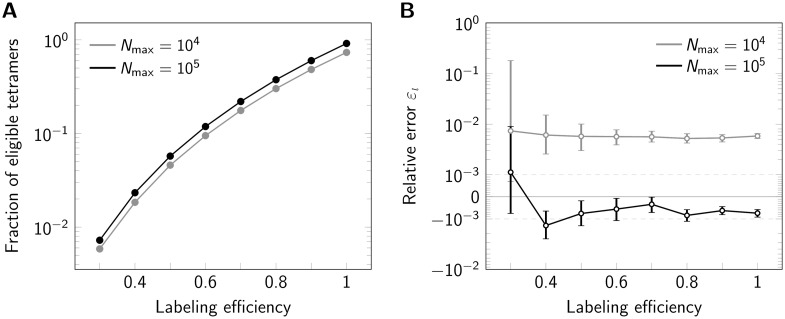
Fig 4. Influence of labeling efficiency.
For each data point 500000 tetramers (side length 5 nm) were simulated, assuming Nmax = 104 photons (gray line) or Nmax = 105 (black line). (A) Percentage of eligible tetramers. (B) Relative error εl shown in a symmetric logarithmic plot. Positive and negative relative errors represent overestimation and underestimation, respectively. Error bars indicate the 95% confidence intervals.

