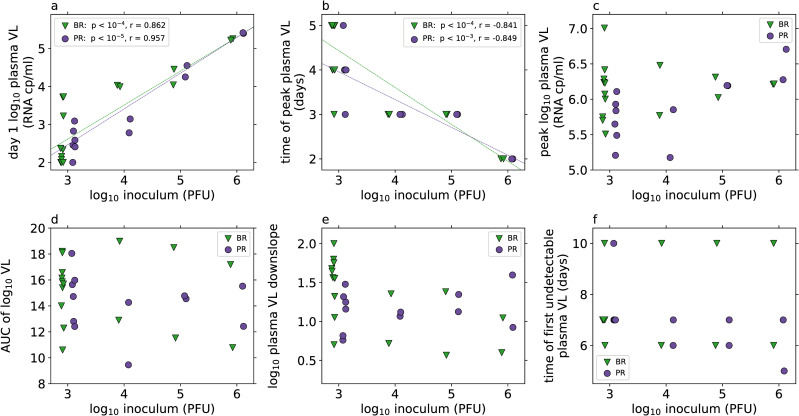
Fig 2. Viral load (VL) characteristics (from measured data, Fig 1) by inoculum dose (log10 PFU, x-axis) and viral strain (indicated by markers, BR: green triangles, PR: purple circles).
Correlations between inoculum dose and VL characteristics are tested by Pearson correlation for each strain separately, and where this is found to be significant at the α = 0.05 level after Bonferroni correction for multiple testing (m = 6) the linear regression line is shown in the panel, and the p-value and correlation coefficient are shown in the legend. Differences in VL characteristics between viral strains for each inoculum group are tested with the Mann-Whitney U test, and none are found to be significant at the α = 0.05 level after Bonferroni correction for multiple testing (m = 6). The day 1 VL, time of peak VL and value of peak VL are the observed measurements. The area under the curve (AUC) of the log10 plasma VL and the downslope of the log10 plasma VL are calculated as described in the methods. Animals with VL data only to day 7 or which do not have any undetectable VLs after the peak are excluded from the analysis of “time of first undetectable plasma VL”.

