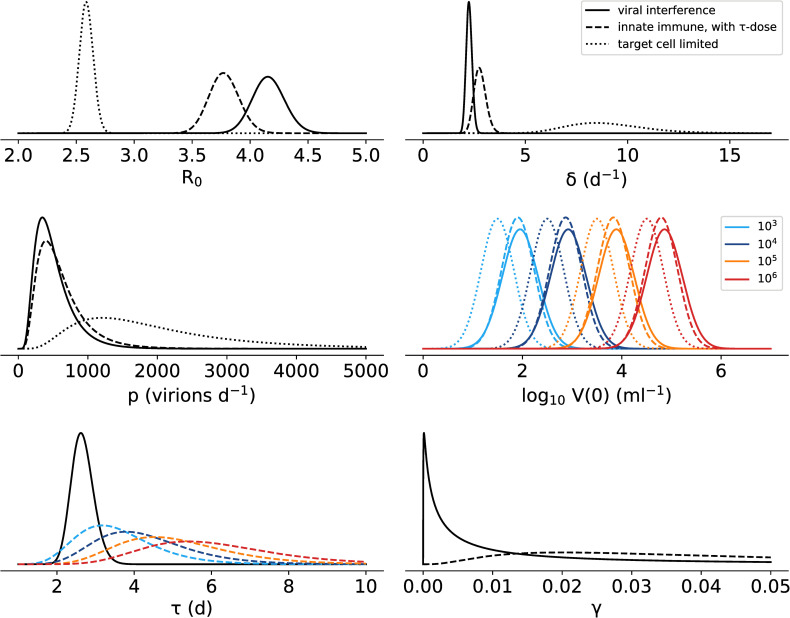
Fig 5.
Estimated parameter distributions for the three model fits: immune response model with viral interference (Eq 3, Table 1, solid line), the innate immune response model including a dose dependency in the timing of the immune response (Eq 2, S6 Table, dashed line) and the target cell limited model (Eq 1, Table 1, dotted line). Where inoculum dose is explicitly included as a covariate in the model, the distributions for each dose are indicated by color.

