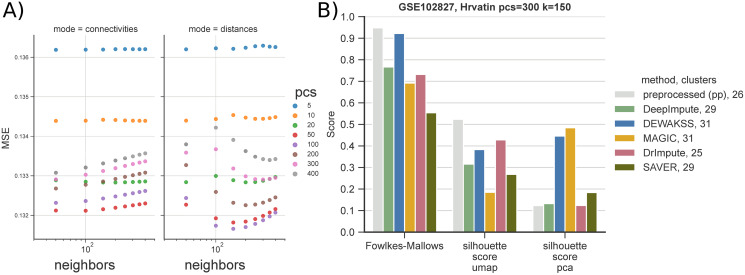
Fig 3. Denoising celltype-annotated data from Hrvatin et al. [33] using metrics from Arisdakessian et al. [27].
The dataset contains 33 annotated celltypes in 48267 cells. A) Optimal denoising of the expression data with DEWÄKSS requires 100 PCs and k = 150 neighbors. B) We benchmark six different denoising pipelines: (i) in-house preprocessed (section 4.4), (pp), (ii) DeepImpute, (iii) DEWÄKSS, (iv) MAGIC, (v) DrImpute and (vi) SAVER. To be able to run (v) and (vi) we down-sample the data to 10% of the annotated cells. After preprocessing & denoising, data is clustered with the Leiden algorithm [19] using 300 PCs and 150 neighbors (resolution is set to r = 1 for DEWÄKSS, r = 2 for preprocessed (pp) and DeepImpute, r = 4 for DrImpute and SAVER, and r = 0.5 for MAGIC). Algorithm performance is measured with the Fowlkes-Mallows metric and silhouette score on two representations of the data, PCA and UMAP.

