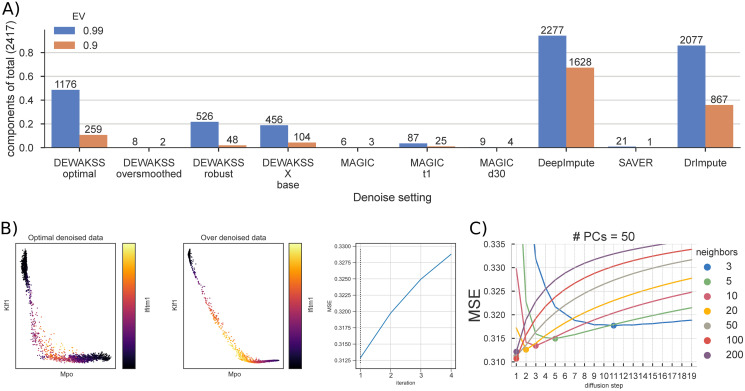
Fig 4. Mouse bone marrow (BM) data denoising.
A) The numbers of principal components needed to explain 99% and 90% of the variance in the data for different hyperparameter values for DEWÄKSS and MAGIC. DEWÄKSS is run with optimal parameters (k = 100, PCs = 50, i = iminMSE), with oversmoothed parameters (k = 100, PCs = 50, i = iminMSE), with robust parameters (k = 10, PCs = 13 selected using MCV as in S1 Section, i = iminMSE), and as X base, where normalized expression values are used instead of PCs with (k = 100, i = iminMSE). MAGIC is run with defaults (d = 15, PCs = 100, k = 15), with early stopping t1 (t = 1), and with d30 (d = 30). B) Expression of erythroid marker gene Klf1, myeloid marker Mpo, and stem cell marker Ifitm1 in DEWÄKSS optimal and DEWÄKSS oversmoothed data. The MSE increases in each iteration. C) The objective function output as a function of diffusion steps for the optimal number of PCs = 50. The minimum MSE is found for 100 neighbors and 1 diffusion step, i.e., using only the selected 100 neighbors.

