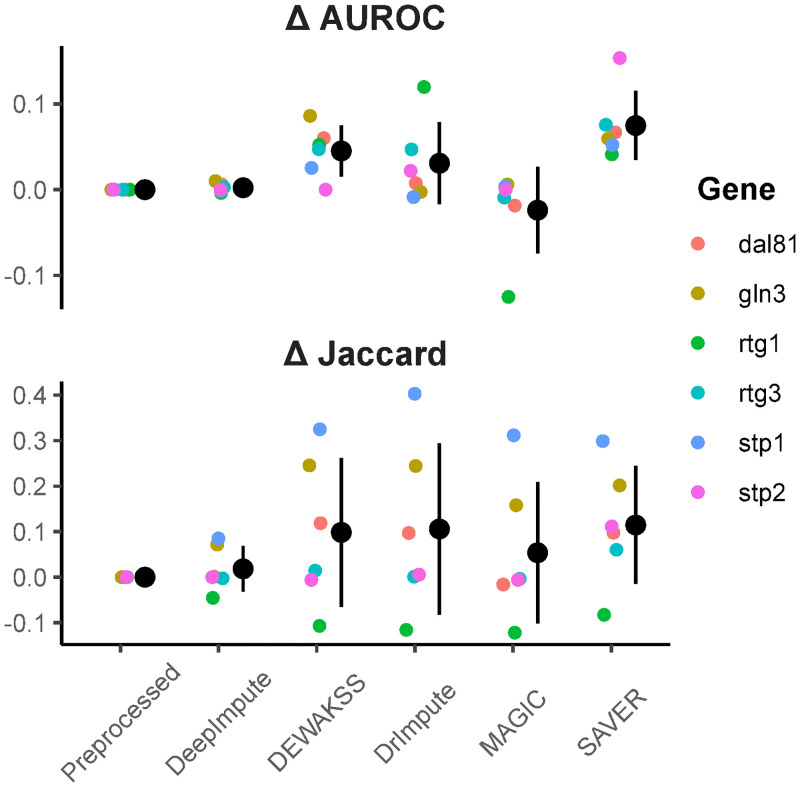
Fig 5. Differentially expressed genes (DEGs) between bulk and single cell data.
Top panel is the delta AUROC for single-cell DEGs ordered by adjusted p-value for each separate deletion strain. Bottom panel is the delta Jaccard index between bulk DEGs and single cell DEGs at FDR = 0.01. Preprocessed is count normalized and log-transformed with no denoising method. Delta is taken between denoised and preprocessed. All computed metrics can be found in S2 Table.

