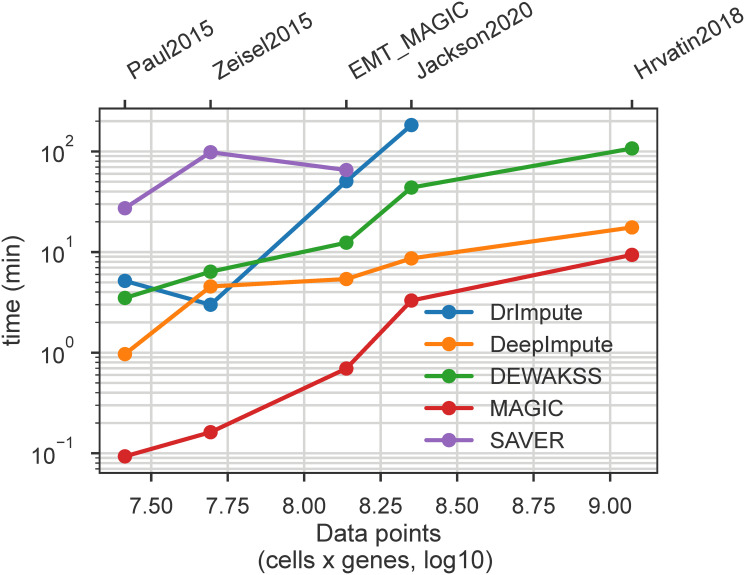
Fig 6. Computational performance of all tested method on selected datasets.
Runtime (minutes) is plotted against the total number of values (cells * genes) in the dataset, to account for differing numbers of genes in each data set. Complete results table is available in S1 Table.

