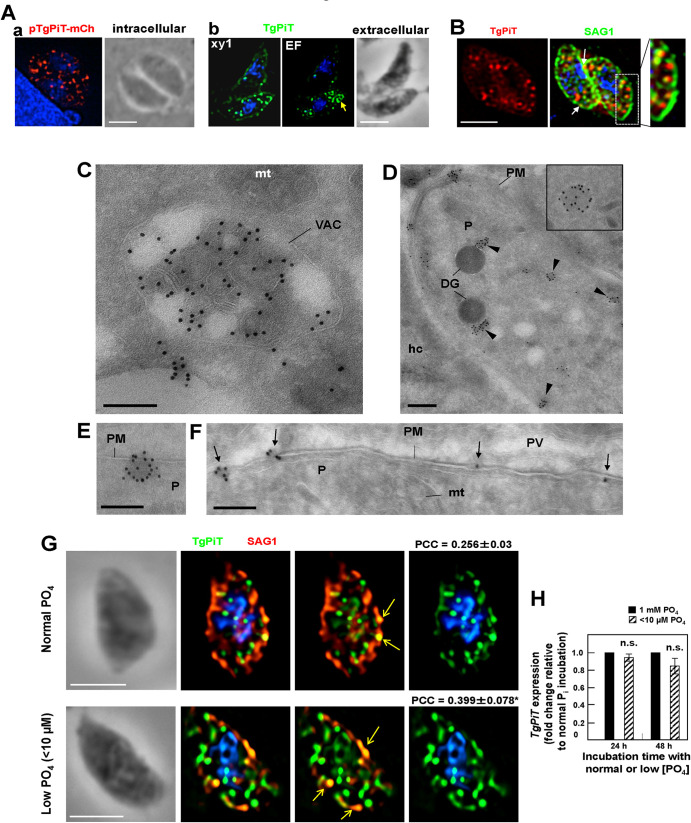
Fig 3. Localization of TgPiT in Toxoplasma.
A. Panel a: Fluorescence microscopy of intracellular Toxoplasma transfected with a plasmid containing TgPiT-mCherry and visualized 16 h post-transfection. An individual z-slice is shown. Panel b: Fluorescence microscopy of extracellular Toxoplasma immunostained with rat anti-TgPiT antibodies. EF, extended focus, xy1, single z-slice. Both panels show intraparasitic puncta for TgPiT. Arrow in panel b points to a larger structure. Scale bars, 5 μm. B. Double IFA using anti-TgPiT and anti-SAG1 antibodies, showing TgPiT signal aligned along the plasma membrane (inset) or at the plasma membrane (arrows). An individual z-slice is shown. Scale bar, 5 μm. C-F. ImmunoEM of Toxoplasma-infected fibroblasts for 24 h using anti-TgPiT antibodies revealed by IgG-gold particles showing TgPiT on the VAC compartments (in C), various vesicles distributed throughout the cytoplasm (in D, arrowheads) or close to the plasma membrane (PM, in E) and at the plasma membrane (C, D, F). DG, dense granules; hc, host cell; mt, mitochondrion; P, parasite. Scale bars, 300 nm. G. IFA on extracellular Toxoplasma using anti-TgPiT and anti-SAG1 antibodies. Prior to the IFA, intracellular parasites have been incubated under normal culture conditions with 1 mM phosphate (PO4) or in phosphate-poor medium with <10 μM PO4 for 24 h before isolation. Arrows show patches of TgPiT co-localizing with SAG1 that are more pronounced under condition of low PO4 conditions. Representative images are show, from 50–65 parasites. Individual z-slices are shown. The Pearson’s correlation coefficient (PCC) was calculated based on the fluorescent signal on the whole parasite. PCC values are means ± SD; *, p<0.05 (unpaired Student’s t-test). H. Real-Time qPCR for transcriptional analyses for TgPiT at 1 mM PO4 or <10 μM PO4 at the indicated times. Data of TgPiT was normalized to parasite α-actin housekeeping gene to calculate 2–ΔΔCT values. Results are graphed as folds of induction, normalized to the TgPiT transcripts at 1 mM PO4 condition. Means ± SD, n = 4 independent assays in triplicate, no significant difference (unpaired Student’s t-test). Scale bars, 5 μm.

