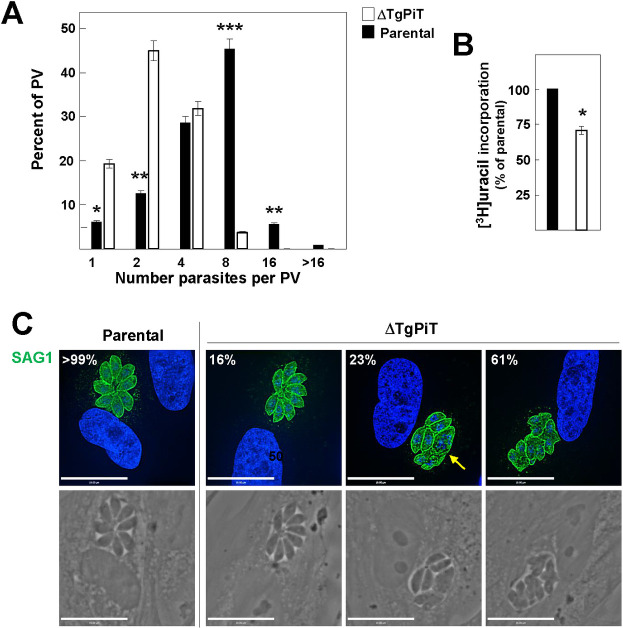
Fig 4. Replication and growth of ΔTgPiT parasites.
A-B. Quantitative measurement of the replication rate of parental and ΔTgPiT parasites 24 h p.i. assessed by parasite counting per PV (A) or [3H]uracil incorporation assays (B), showing replication delay for the knockout. Data in A and B are means ± SD, n = 3 independent assays. *, p<0.05; **, p<0.01; ***, p<0.005; (unpaired Student’s t-test). C. IFA of infected HFF for 24 h with parental or ΔTgPiT parasites with anti-SAG1 antibodies showing % representative images of 40–60 PV, revealing aberrant cell shape of the knockout (arrow). Individual z-slices are shown.

