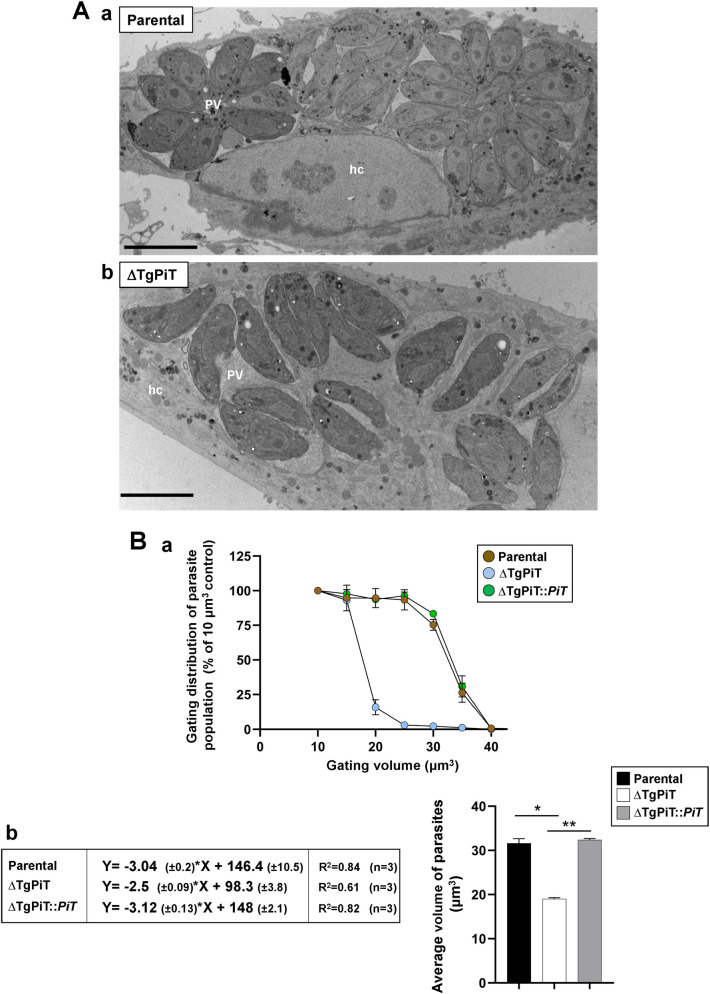
Fig 7. Cell volume of ΔTgPiT parasites.
A. EM of HFF infected for 24 h with parental or ΔTgPiT parasites. Comparison between parental (panel a) and ΔTgPiT (panel b) parasites for PV size and parasite global morphology, showing abnormally thinner knockout parasites. Bars, 10 μm. B. Cell volume measurement of parental, ΔTgPiT and ΔTgPiT::PiT parasites using a Coulter counter. Panel a: volume distribution of parasites. Extracellular parasites were counted after gating on the basis of 6 different volumes, starting from 10 μm3 to 40 μm3, with 5 μm3 increments. The percent of parasite population was normalized to 100% of the population at the 10 μm3 gate as all parasites were found to have a larger volume that this gate. Data are mean ± SEM, n = 3 independent assays with samples in triplicate. P values calculated using Fisher's LSD test were statistically significant between parental and ΔTgPiT parasites (p = 0.0173), and between complemented and ΔTgPiT parasites (p = 0.0023). Panel b: Linear regression equations for volume assessment of parental, ΔTgPiT and ΔTgPiT::PiT parasites. Average volumes were determined based on curves of the % population decline with increased gating volumes (in panel a) from each independent biological replicate. A linear regression was calculated with Y = % of parasite population and X = parasite volume. Data are mean ± SEM (n = 3). *, p = 0.0035; **, p<0.0001 (Uncorrected Fisher's LSD).

