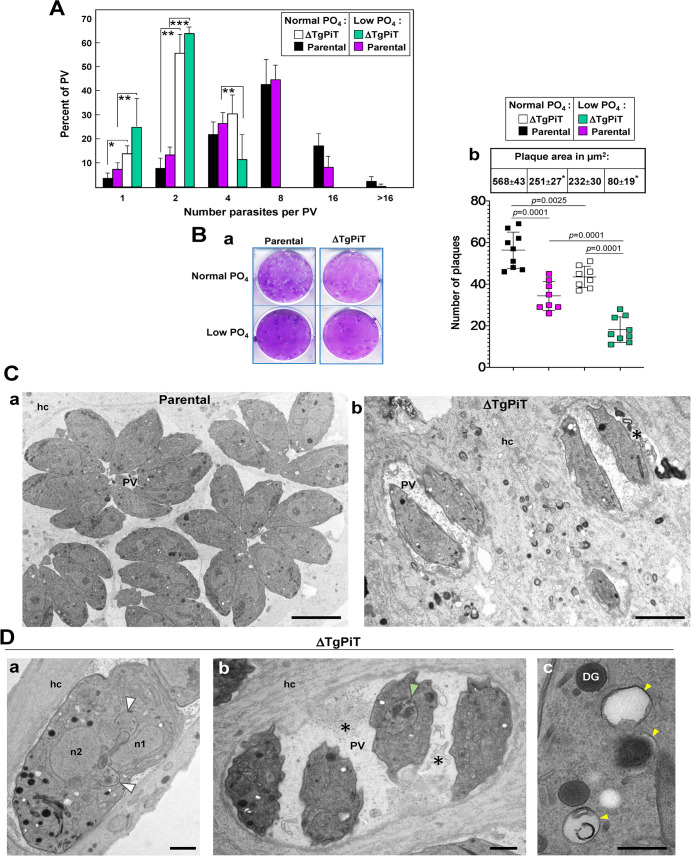
Fig 10. Development and ultrastructure of ΔTgPiT parasites upon phosphate deprivation.
A. Quantitative measurement of parental and ΔTgPiT parasite replication 24 h p.i. assessed by parasite enumeration after incubation in normal or low PO4 conditions. No statistical differences using a p-value are observed between normal and low PO4 concentrations within each parasite group. Statistical differences are observed between parental or ΔTgPiT parasites at normal and low PO4 concentrations. *, p<0.05; **, p<0.001; ***, p<0.0025 (unpaired Student’s t-test). B. Parasite growth quantification by plaque assays. Confluent monolayers of HFF were infected with 100 parental or ΔTgPiT parasites and maintained in normal or low PO4 for 7 days before counting the plaques and measuring their size, from 4 or 5 independent assays in triplicate. Panel a shows representative images of lysis plaques for the 4 conditions. Panel b are dotplot graphs for plaque number with p-values (unpaired Student’s t-test) and the table is means ± SD of plaque area (*, p<0.01 between normal and low PO4 within each parasite group). C-D. EM of HFF infected for 24 h with parental or ΔTgPiT parasites at low PO4. C. Comparison between parental (panel a) and ΔTgPiT (panel b) parasites for PV size and parasite global morphology, showing rachitic knockout parasites. Bars, 5 μm. D. ΔTgPiT parasites showing: in panel a, an abnormally enlarged dividing parasite with two nuclei (n1 and n2), two nascent apexes (arrowheads), in panel b, four misshapen parasites with one poorly dividing (arrowhead) and membranar debris (asterisks as in Fig 11A, panel b) in the PV lumen, and in panel c, 3 acidocalcisomes (arrowheads). Bars, 500 nm. DG, dense granules; hc, host cell; n, nucleus.

