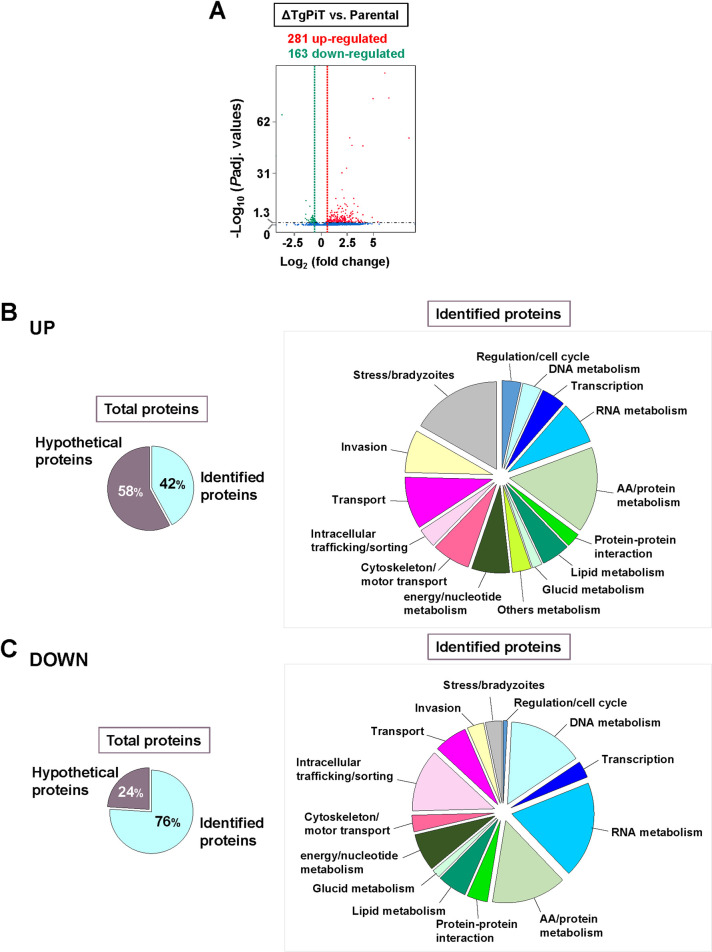
Fig 13. RNA-Seq comparison between ΔTgPiT and parental parasites.
A. Volcano plot revealing 281 genes having increased expression (red) and 163 with decreased expression (green), with statistical significance less than 0.05 in the ΔTgPiT relative to the parental strain. The green and red dashed lines represent the borderline of Log2 fold change of 0.4 in gene transcripts, and the genes above the black dashed line had padj values of statistical significance below 0.05. Each sample was sequenced in duplicate for statistical comparison. B-C. Left: Pie charts plotting the percent of proteins whose genes are up-regulated (in B) or down-regulated (in C), identified in the ToxoDB. Right: Pie charts categorizing the identified proteins based on their biological functions.

