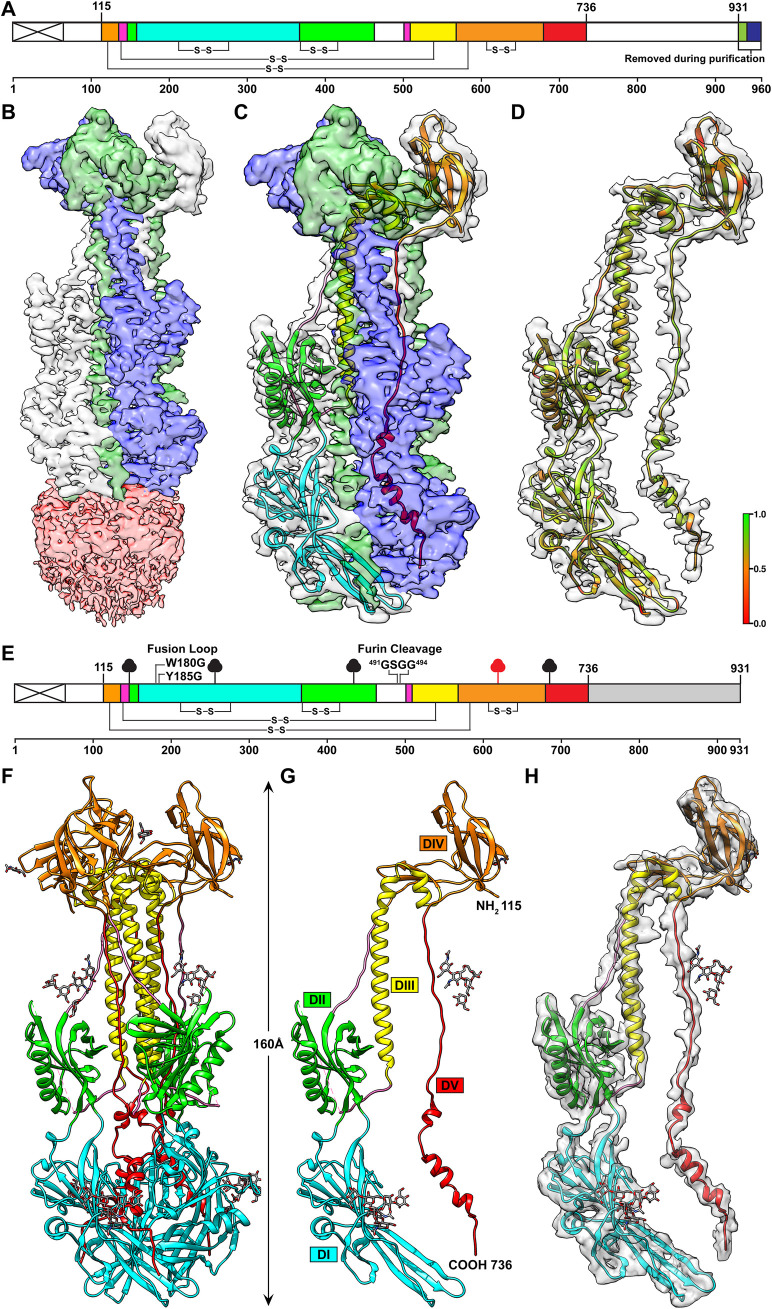
Fig 5. Near atomic resolution structures of VZV gB native, full-length VZV gB purified from VZV infected MeWo cells and the ectodomain transiently expressed in HEK293 GnTl- cells.
A–A diagram of the linear structure for VZV gB expressed by the pOka-gB-TEVV5 virus. The signal sequence is depicted by the crossed white box. Colored regions between residues 115–736 represent those that were resolved in the cryo-EM structure; DI (cyan), DII (green), DIII (yellow), DIV (orange), DV (red) and linker regions (hot pink). Disulphide bonds are represnted by the connecting lines. The colored regions beyond residue 931 represent the tag used for purification of gB from infected cells; TEV cleavage site (lime green) and V5 tag (blue). B–The cryo-EM map of native, full-length VZV gB constrained to C3 symmetry (3.9Å). The ectodomain is based on a focussed refinement map with each protomer of the gB ectodomain highlighted in different colors (blue, white and green) and the CTD represented at a lower threshold (pink). C–A ribbon diagram for the gB ectodomain structure is colored as for the diagram in A. D–Segmentaion and MapQ analysis of the VZV gB cryo-EM map based on a single protomer of the gB ectodomain. The scale, red to green (0 to 1), represents the goodness of fit of the cryo-EM map with the structure using MapQ. E–The linear structure of the truncated VZV gB used for X-ray crystallography. The signal sequence is depicted by the crossed white box. Colored regions between residues 115–736 represent those that were resolved in the gB crystal structure from transiently transfected cells; DI (cyan), DII (green), DIII (yellow), DIV (orange), DV (red) and linker regions (hot pink). The location of the residues that were substituted in the fusion loop (W180G and Y186G) and the furin cleavage site (481GSGG484) of the gB ectodomain expression construct used for X-ray crytsallography are indicated. The white regions represent portions of gB that were not resolved in the crystal structure. The grey shaded box indicates the truncation. The clubs represent glycosylation sites in the X-ray crystallography data (black) or by orbitrap mass spectrometry (red). F to H–The X-ray crystal structure of VZV gB ectodomain at 2.4Å. Ribbon diagrams of the gB trimer (F), monomer (G) and the monomer superimposed with a portion of a segmentation of the 3.9 Å cryo-EM map.

