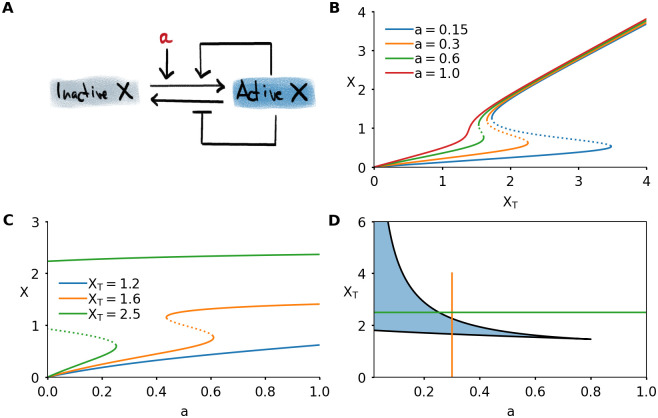
Fig 3. A simple model of protein activity shows bistability.
A) Interaction diagram of a model consisting of single protein which can be active or inactive. Active protein promotes its own activation and inhibits its inactivation. The basal activation rate is given by the parameter a. B) Steady state response to total protein XT, for different values of a. C) Steady state response to basal activation rate a, for different values of total concentration XT. D) Two-parameter bifurcation diagram of the system. The bistable region is shaded. The vertical orange curve, when followed from bottom to top, corresponds to the orange response curve in Panel B. The horizontal green curve, followed from left to right, corresponds to the green response curve in Panel C. Parameter values not mentioned in the plots can be found in Table 1 in the Methods section.

