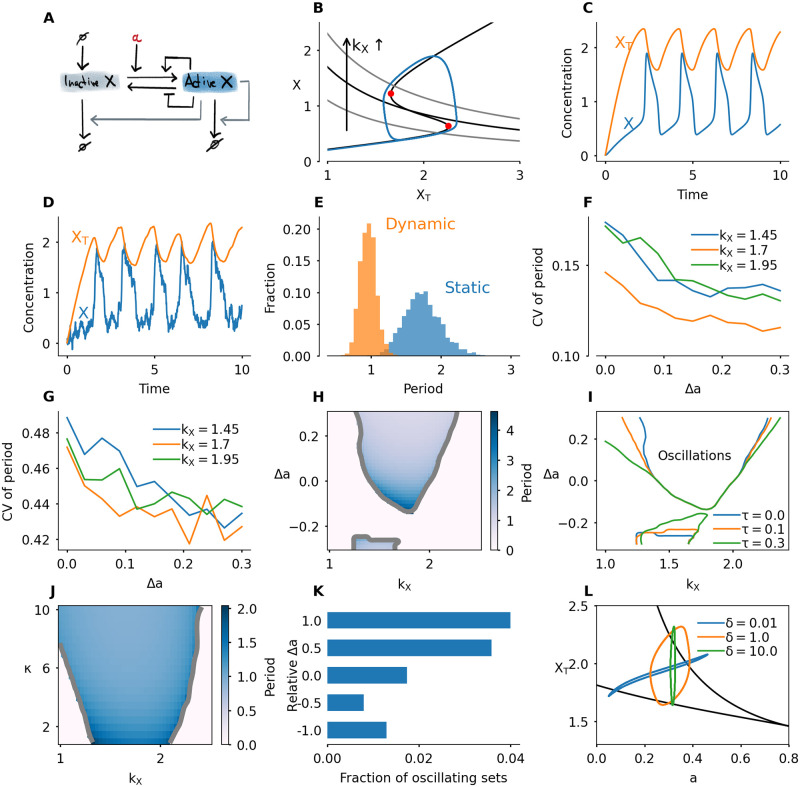
Fig 5. Dynamic switches promote oscillations.
A) Interaction diagram. The active form of protein X promotes its own degradation. B) Phaseplane of the system given by Eq 5 (static switch). The second nullcline depends on the value of kX. The S-shaped nullcline has the same shape as the bistable response curve studied in the previous section. The second nullcline is given by X = kX/XT and is shown for kX = 1.1, 1.7 and 2.3. The blue limit cycle corresponds to kX = 1.7. C) Time series of the oscillatory system with kX = 1.7. D) Time series for the system with noise, σ = 0.6. E) Histogram of the period for a static (Δa = 0) and dynamic (Δa = 0.3) switch, with . F) Coefficient of variation (standard deviation divided by mean, CV) of the period in the oscillatory system with noise added to the X-variable. Here κ = 5, σ = 0.6. G) Coefficient of variation for the stochastic simulation algorithm, with Ω = 10. H) Period in color, as function of kX and Δa with . I) Oscillatory region in the (kX, Δa)-plane for different values of the delay time τ with . J) Period as function of kX and κ with and τ = 0.1. K) Fraction of parameter sets for which the system oscillates for 10000 randomly sampled parameter sets. L) Three different limit cycles of the three equation system given by Eq 8. The parameter δ defines the timescale on which a changes. See S6 Video for an animation corresponding to this panel. All parameters not described above can be found in the methods section, Table 1. For the Langevin version, statistics were obtained from runs for a total time of T = 2000 (Panels E,F). For the SSA version, the total run time was T = 4000 (Panel G).

