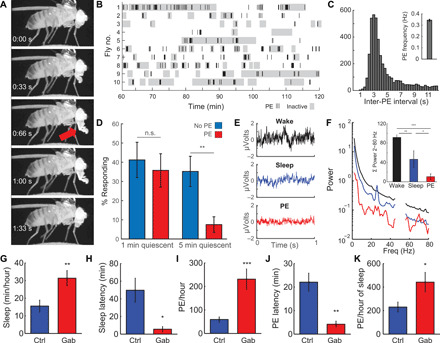
Fig. 1. PEs occur during a deep sleep stage.

(A) A PE consists of a full extension of the proboscis (red arrow), immediately followed by a full retraction. This process takes ~1.4 s. (B) Raster plot showing PE (each bar, 1 PE) and inactivity (gray blocks, 60-s inactivity threshold) for 1 hour (61 to 120 min after being tethered). Most inactivity bouts contain one or more PEs. (C) During PE bursts, inter-PE intervals are highly regular, with one PE occurring every 3 s (inset; average PE frequency is 0.34 Hz). (D) Arousal thresholds for flies that were inactive or inactive and making PE. After 5, but not 1, min of inactivity, flies making PE have greatly increased arousal thresholds. n = 8 to 13 per group; **P < 0.01, t test. n.s., not significant. (E) Representative 1-s traces for LFPs during wake, sleep, and PE. (F) Average power spectra of LFPs for flies that were awake, asleep, or producing PE show that LFP power is lower during PE compared to wake or sleep (inset). The data have been notch-filtered at 50 Hz (Australian line noise). n = 9; *P < 0.05, **P < 0.01, and ***P < 0.001 [analysis of variance (ANOVA) with Bonferroni test]. (G) Feeding flies Gaboxadol food (0.2 mg/ml) induces sleep (H) and decreases sleep latency (occurrence of first sleep bout after being tethered). (I) PEs per hour are greatly increased. (J) PE latency, the time to detection of the first PE after being tethered, is decreased. (K) Amount of PE per hour of sleep is increased after Gaboxadol administration. n = 15 control and n = 9 Gaboxadol; *P < 0.05, **P < 0.01, ***P < 0.001, two-tailed t test. Error bars indicate SEM. All error bars indicate SEM.
