
Fig. 4. Exogenous MNA enhances TNFα expression and inhibits IFN-γ production in T cells.
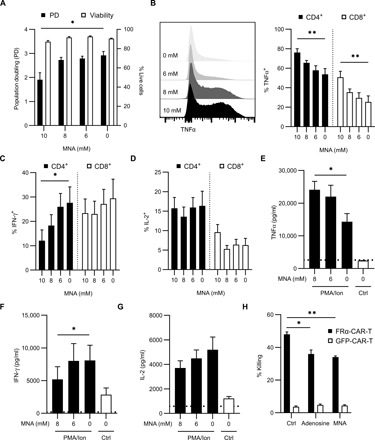
(A) Total live cell count and population doubling (PD) directly from culture on day 7. Bar graphs represent means + SEM of six healthy donors. Data representative of at least n = 3 independent experiments. (B to D) T cells were activated using CD3/CD28 with IL-2 in respective concentrations of MNA for 7 days. Cells were stimulated with PMA/ionomycin with GolgiStop for 4 hours before analysis. TNFα (B) expression in T cells. Example plot of TNFα expression in live cells (left) and tabulated data (right). IFN-γ (C) and IL-2 (D) expression in T cells. Cytokine expression was measured by flow cytometry. Bar graphs represent means (n = 6 healthy donors) + SEM. P value determined using a one-way ANOVA with repeated measures (*P < 0.05 and **P < 0.01). Data representative of at least n = 3 independent experiments. (E to G) T cells were activated using CD3/CD28 with IL-2 in respective concentrations of MNA for 7 days. Media was collected before (Ctrl) and after PMA/ionomycin stimulation for 4 hours. Concentration of TNFα (E), IFN-γ (F), and IL-2 (G) was measured by ELISA. Bar graphs represent means (n = 5 healthy donors) + SEM. P value determined using a one-way ANOVA with repeated measures (*P < 0.05). Dotted line indicates the limit of detection for the assay. (H) Cytolytic assay. FRα-CAR-T or GFP-CAR-T cells were conditioned with adenosine (250 μM) or MNA (10 mM) for 24 hours, or left untreated (Ctrl). Percentage of killing was measured against SK-OV-3 cells. P value determined by Welch’s t test (*P < 0.5 and **P < 0.01).