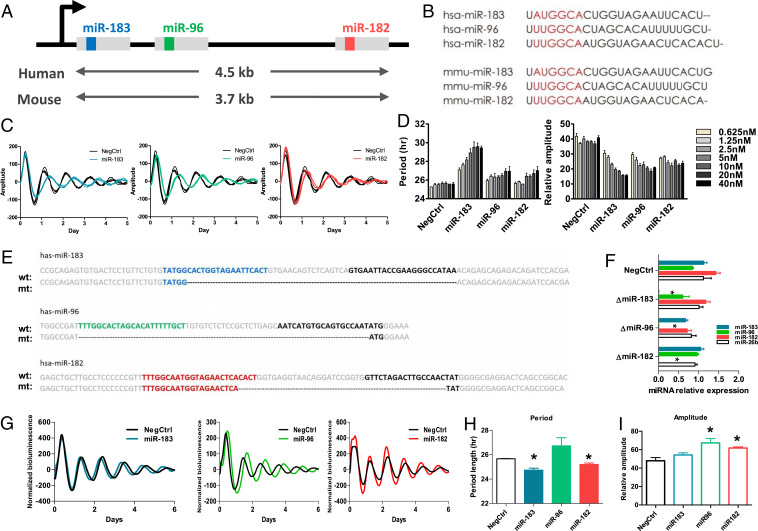
Fig. 2.
The cluster of miR-183/96/182 altered the circadian period length and amplitude at the cellular level. (A) Schematic diagram showing the miR-183/96/182 cluster on the chromosome. Members of the miR-183/96/182 cluster locate on the same chromosome and are cotranscribed through the same promoter. The gray blocks represent the primary miRNA. The inside color boxes (blue, green, and red) represent the sequences for miR-183-5p, miR-96-5p, and miR-182-5p, respectively. (B) The sequences of mature miRNA for members of the miR-183/96/182 cluster in human and mouse. The red region represents the seed region of each miRNA, which exhibits high similarity. (C) Representative bioluminescence profiles of U2OS Per2-dLuc reporter cells which were transfected with 10 nM synthetic miRNA mimics of each member of the miR-183/96/182. (D) The dose-dependent effects of members of the miR-183-/96/182 cluster on period length. U2OS Per2-dLuc reporter cells were transfected with the indicated amount of miRNAs (five 2-fold dilution series from 2.5 to 40 nM/well). The data represent the mean ± SD (n = 4). (E) Knockout of each member of the miR-183/96/182 cluster using a CRISPR-Cas9 approach. For each miRNA, the “wt” sequence represents the sequence of wild-type primary miRNA, and the “mt” sequence represents the mutant sequence of primary miRNA after deletion. The colored sequences (blue, green, and red) represent the 5′ miRNA, and the black sequences represent the 3′ miRNA. Deletions are marked by dashes. (F) The mature miRNA expression levels detected by qPCR confirmed the complete deletion of each miRNA. (G) Representative bioluminescence profiles for each CRISPR miRNA deletion cell line. (H) Period lengths of CRISPR miRNA deletion cell lines. (I) Amplitude of CRISPR miRNA deletion cell lines. Data represent the mean ± SEM (n = 3), *P < 0.05.

