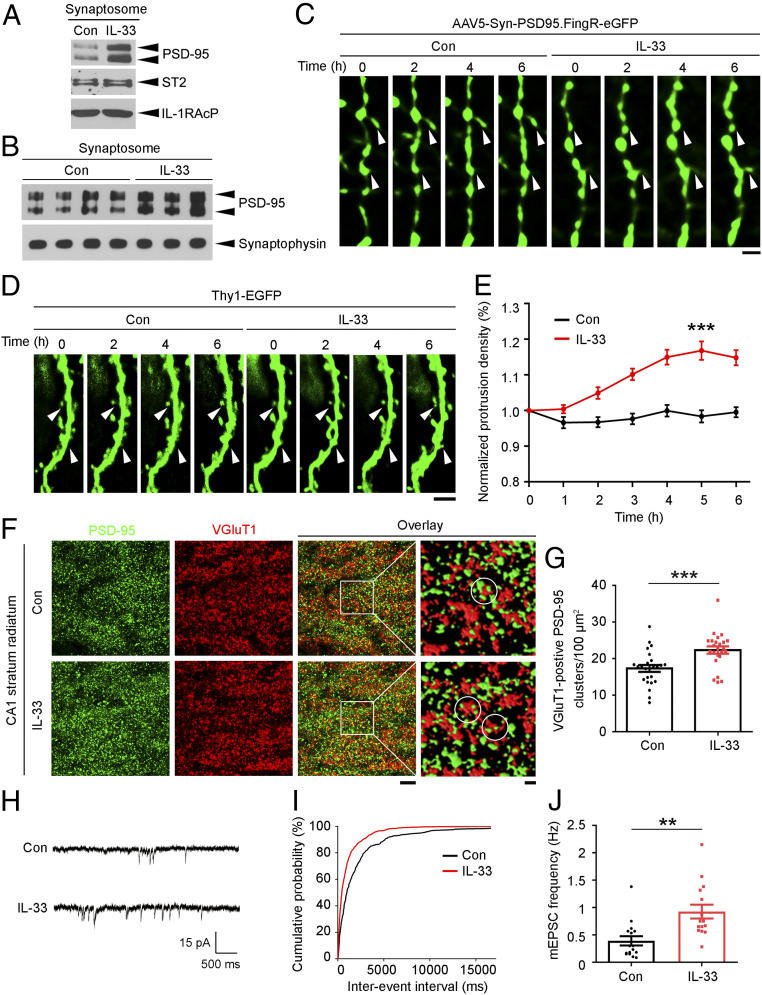
Fig. 4.
IL-33 promotes excitatory synaptogenesis by enhancing PSD-95 accumulation at synapses. (A and B) Western blot analysis of PSD-95 in the synaptosomes of IL-33-treated cultured hippocampal neurons (A) and hippocampi from 3-mo-old C57 mice (B). (C) Time-lapse images showing GFP-labeled PSD-95 clusters on the dendritic spines (white arrowheads) of hippocampal CA1 pyramidal neurons after vehicle (Dulbecco’s phosphate-buffered saline [DPBS]; Con) or IL-33 (200 ng) injection. (Scale bar, 2 μm.) (D and E) IL-33 increased the number of dendritic protrusions in the CA1 pyramidal neurons of 3-mo-old C57 mice. (D) Time-lapse images showing morphological changes in the dendritic spines (white arrowheads) of EGFP-expressing dendrites. (Scale bar, 5 μm.) (E) Quantification of normalized dendritic protrusion density (***P < 0.001, 5 h IL-33 vs. Con; two-tailed unpaired t test; Con: n = 35 dendrites; IL-33: n = 42 dendrites; four mice per group). (F and G) Immunohistochemical analysis of PSD-95 and VGluT1 in the hippocampal CA1 stratum radiatum subregion after administration of IL-33 (200 ng, 4 h). (F) Representative images including overlay images (Scale bar on Left, 5 μm.) and higher-magnification segmented images showing PSD-95 and VGluT1 clusters (Scale bar on Right, 1 μm.). White circles indicate VGluT1-positive PSD-95 clusters. (G) Quantification of VGluT1-positive PSD-95 clusters (***P < 0.001, two-tailed unpaired t test; Con: n = 25 images; IL-33: n = 24 images; three mice per group). (H–J) Increased excitatory synaptic transmission in hippocampal CA1 pyramidal neurons in 3-mo-old C57 mice treated with IL-33 (200 ng, 4 h). (H) Representative traces of mEPSCs recorded in hippocampal slices. (I) Cumulative probability distributions of mEPSC interevent intervals. (J) Quantification of mean mEPSC frequency (**P < 0.01, two-tailed unpaired t test; Con: n = 16 neurons; IL-33: n = 15 neurons; three mice per group). Values are the mean ± SEM. See also SI Appendix, Figs. S5–S8.

