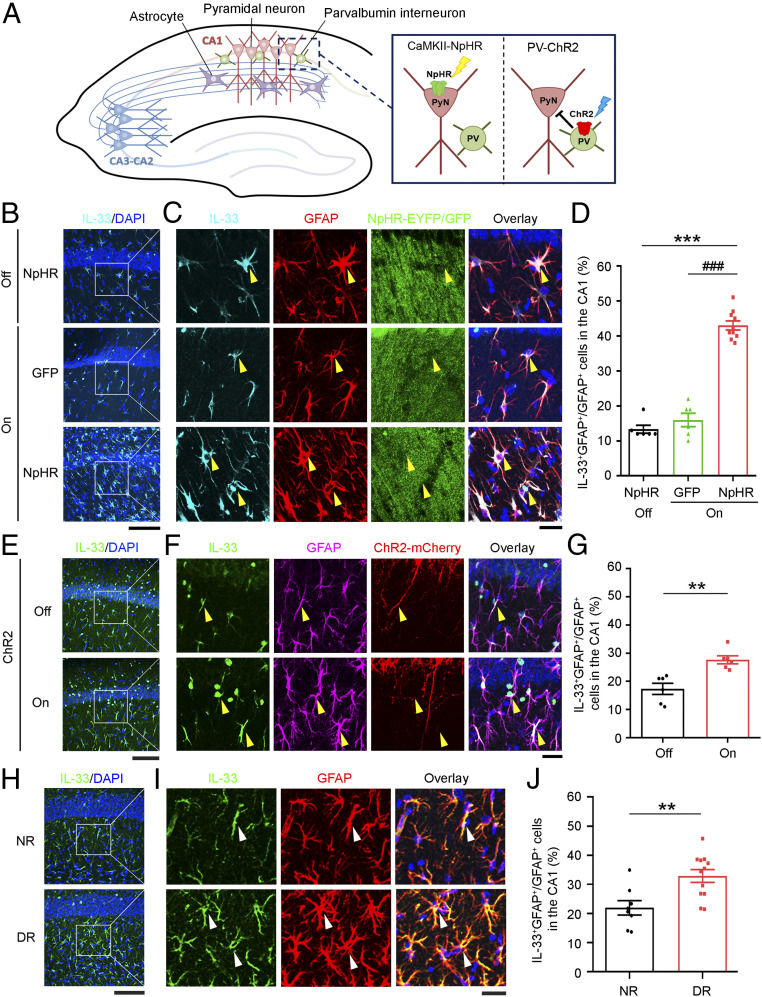
Fig. 5.
Inhibition of hippocampal neuronal activity in adult mice increases the IL-33 protein level in CA1 astrocytes. (A) Schematic diagram of the experimental design for the optogenetic manipulation of neuronal activity in the hippocampal CA1 microcircuitry. (B) Immunohistochemical analysis of IL-33 and DAPI counterstaining in the hippocampal CA1 region in adult mice expressing CamKII-NpHR (halorhodopsin) or GFP without (off) or with (on) 1-h laser stimulation. (C) Higher-magnification images showing IL-33-expressing astrocytes (yellow arrowheads) and an overlay with DAPI counterstaining in the CA1 stratum radiatum subregion. (Scale bars, 100 μm in B and 25 μm in C.) (D) Quantification of IL-33-positive astrocytes (***P < 0.001, on/NpHR vs. off/NpHR; ###P < 0.001, on/NpHR vs. on/GFP; one-way ANOVA; off/NpHR and on/GFP: n = 6 brain sections from three mice per group; on/NpHR: n = 10 brain sections from five mice). (E) Immunohistochemical analysis of IL-33 and DAPI counterstaining in the hippocampal CA1 region in adult mice expressing PV-ChR2 (channelrhodopsin-2) without (off) or with (on) 1-h laser stimulation. (F) Higher-magnification images showing IL-33-expressing astrocytes (yellow arrowheads) and an overlay with DAPI counterstaining. (Scale bars, 100 μm in E and 25 μm in F.) (G) Quantification of IL-33-positive astrocytes (**P < 0.01, two-tailed unpaired t test; n = 6 brain sections from three mice per group). (H–J) Dark rearing increased IL-33 protein levels in astrocytes in the hippocampal CA1 stratum radiatum subregion in mice. Hippocampal samples were collected from normally reared (NR) and dark-reared (DR) mice after the eye-opening period on postnatal day 15. (H) Immunohistochemical analysis of IL-33 and DAPI counterstaining in the hippocampal CA1 region. (I) Higher-magnification images showing IL-33-expressing astrocytes (white arrowheads) and an overlay with DAPI counterstaining. (Scale bars, 100 μm in H and 25 μm in I.) (J) Quantification of IL-33-positive astrocytes (**P < 0.01, two-tailed unpaired t test; NR: n = 8 brain sections from three mice; DR: n = 12 brain sections from four mice). Values are the mean ± SEM. See also SI Appendix, Figs. S9–S11.

