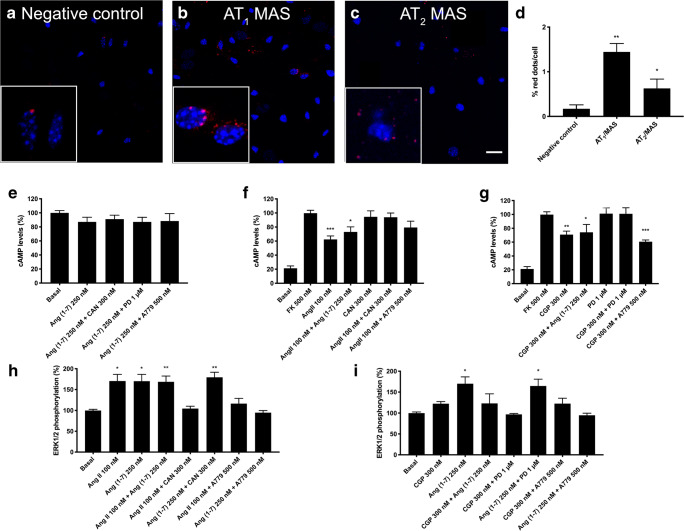
Fig. 4.
AT1-MasHet and AT2-MasHet expression and function in primary cultures of striatal neurons. A–C Expression of AT1-MasHets and AT2-MasHets heteromers was determined by proximity ligation assay (PLA), which was performed using specific primary antibodies against AT1, AT2, and Mas receptors. Confocal microscopy images (stacks of 4 consecutive planes) show heteroreceptor complexes; nuclei are Hoechst-stained (blue). Scale bar: 20 μm. D Bar graph showing the percentage of AT1R-MasR and AT2R-MasR clusters as red dots/cell compared with the negative control (*p < 0.05, **p < 0.01; Student’s t test vs the negative control condition). For cAMP (E–G) or ERK1/2 phosphorylation (H, I), cells were pretreated with selective receptor antagonists (300 nM candesartan for AT1R, 1 μM PD123319 for AT2R, and 500 nM A779 for MasR) and subsequently treated with selective agonists (100 nM Ang II for AT1R, 300 nM CGP-42112A for AT2R, and 250 nM Ang(1-7) for MasR). Values are the mean ± SEM of 5 independent experiments performed in triplicate. One-way ANOVA followed by Bonferroni’s multiple comparison post hoc tests were used for statistical analysis. *p < 0.05, **p < 0.01, ***p < 0.001 versus forskolin treatment in cAMP determinations or versus vehicle treatment (basal) in pERK determinations

