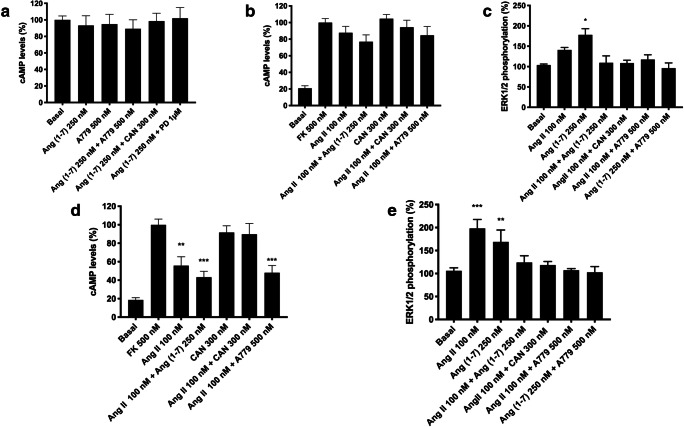
Fig. 6.
AT1-MasHet function in primary cultures of microglia. A–E Microglia in primary cultures were incubated for 48 h with 1 μM LPS and 200 U/mL IFN-γ (D, E) or vehicle (A–C). Then, cultures were pretreated with selective receptor antagonists (300 nM candesartan for AT1R, 1 μM PD123319 for AT2R, and 500 nM A779 for MasR) and subsequently treated with selective agonists (100 nM Ang II for AT1R, 300 nM CGP-42112A for AT2R, and 250 nM Ang [1–7] for MasR). Cytosolic cAMP levels (A, B, D) and ERK1/2 phosphorylation (C, E) were subsequently determined. Values are the mean ± SEM of 5 independent experiments performed in triplicate. One-way ANOVA followed by Bonferroni’s multiple comparison post hoc test were used for statistical analysis. *p < 0.05, **p < 0.01, ***p < 0.001 versus basal treatment (A) or forskolin treatment (B, D) in cAMP measurements or versus vehicle in pERK measurements (C, E)

