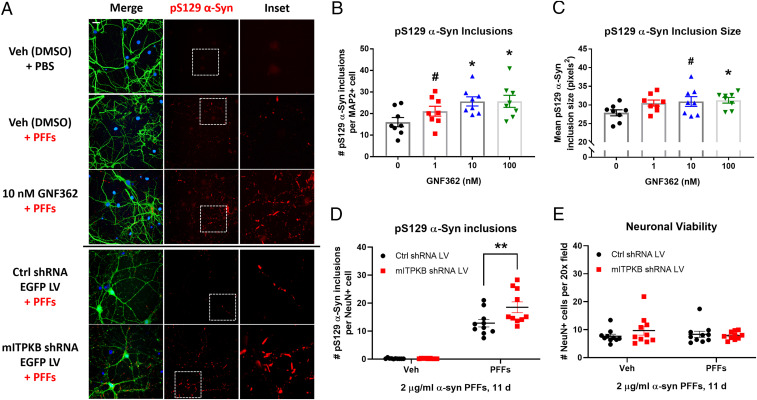
Fig. 1.
ITPKB inhibition increases α-syn pathology induced by preformed fibrils. (A) Representative images of DIV 20 neurons immunostained for pS129 α-syn (red), the neuronal marker MAP2 (Top, green), and DAPI (blue); LV-transduced cells are labeled with EGFP expressed from the same virus as the shRNAs (Bottom). Scale bar, 10 µm. (B) Quantification of the number of pS129 α-syn inclusions per MAP2-positive cell in A. #P = 0.1501; *P = 0.0197 (10 nM); *P = 0.0193 (100 nM) by one-way ANOVA with Dunnett’s post hoc test (versus the 0 nM treatment group); n = 8 wells/group. (C) Quantification of the mean pS129 α-syn inclusion size in GNF362-treated cultures in A. #P = 0.0806; *P = 0.0473 by one-way ANOVA with Dunnett’s post hoc test (versus the 0 nM treatment group); n = 8 wells/group. (D) Quantification of the number of pS129 α-syn inclusions per NeuN-positive cell in cells transduced with control (Ctrl) or mITPKB shRNA LV from A. **P = 0.0035 by two-way ANOVA with Sidak’s post hoc test; n = 10 wells/group. (E) Quantification of the number of NeuN-positive cells per 20× field in cells transduced with Ctrl or mITPKB shRNA LV from A. Note that no toxicity was observed for either the mITPKB shRNA LV or treatment with PFFs. All figures shown are representative examples of the experiments repeated at least three times in independent cultures of primary neurons with different plate layouts. All bar graphs represent the mean ± SEM.

