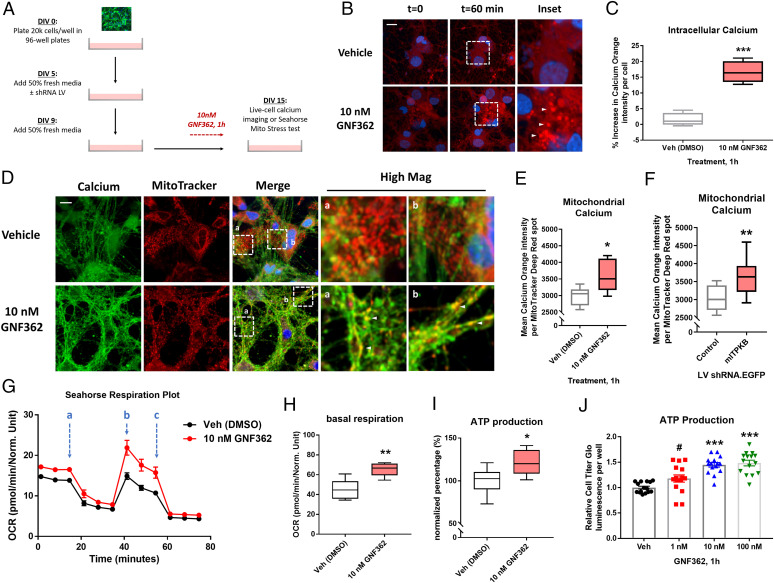
Fig. 3.
ITPKB inhibition increases mitochondrial calcium levels and ATP production. (A) A diagram of experimental design for live-cell calcium imaging and respiration experiments in primary neurons treated with GNF362 or transduced with LVs. (B) Representative images of Calcium Orange AM dye fluorescence intensity following 1 h treatment with 10 nM GNF362. (C) Quantification of the mean percent increase in Calcium Orange AM dye fluorescence intensity per DAPI+ cells at t = 60 min compared to t = 0. ***P < 0.001 by unpaired Mann–Whitney U test; n = 6 wells/group. (D) Representative images of Calcium Orange AM dye (shown in green to highlight colocalization) and MitoTracker Deep Red (red) fluorescence in DIV 15 cultures treated with 10 nM GNF362 for 1 h. (E) Quantification of mean Calcium Orange AM fluorescence intensity per MitoTracker Deep Red–positive spot in D. *P = 0.0411 by unpaired Mann–Whitney U test; n = 6 wells/group. (F) Quantification of mean Calcium Orange AM fluorescence intensity per MitoTracker Deep Red–positive spot in cultures transduced with control or mITPKB shRNA LV. **P = 0.0036 by unpaired Mann–Whitney U test; n = 12 wells/group. (G) A representative respiration plot of cultures analyzed by the Seahorse XF Mito Stress Test following pretreatment with vehicle (DMSO, black line) or 10 nM GNF362 (red line). The OCR was measured over time starting at baseline and following sequential treatment with 1 µM oligomycin (A), 1.5 µM FCCP (B), and 0.5 µM antimycin/rotenone (C). (H–I) Quantification of baseline OCR (H) and total ATP production (I) from G. **P = 0.0043; *P = 0.0118 by two-tailed Mann–Whitney U test; n = 6 wells/group. All box and whisker plots represent median ± interquartile range (box) from minimum to maximum (whiskers). (J) The total cellular ATP levels measured by relative Cell Titer Glo luminescence per well following 1 h treatment with GNF362. ***P < 0.001; #P = 0.0853 by one-way ANOVA with Tukey’s post hoc test; n = 15 wells/group. The bar graphs represent mean ± SEM. All Seahorse respiration experiments were repeated at least three times in independent cultures of primary neurons with different plate layouts (SI Appendix, Fig. S6 I and J).

