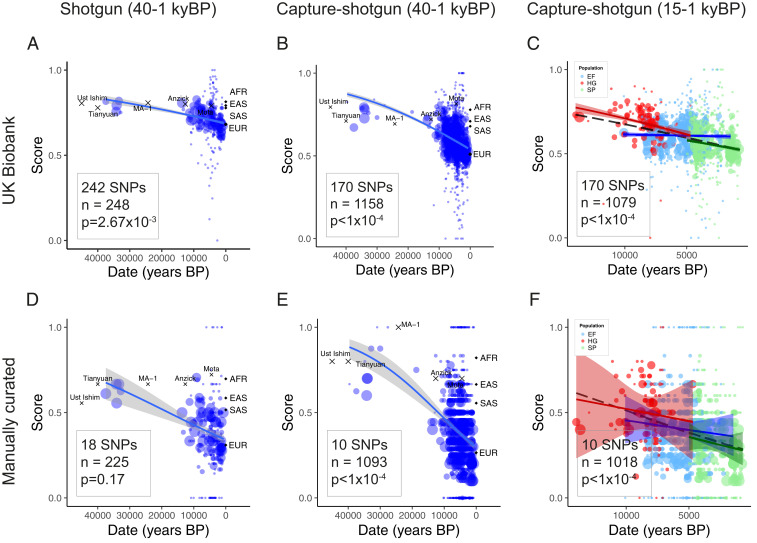
Fig. 1.
Genetic scores for skin pigmentation over time. The solid lines indicate fitted mean scores with gray 95% confidence intervals. Weighted scores based on UK Biobank SNPs and unweighted scores based on manually curated SNPs for samples in the (A and D) shotgun dataset, (B and E) capture-shotgun dataset, and (C and F) capture-shotgun dataset dated within the past 15,000 y. Scores of labeled samples are plotted but not included in regressions. Averages for 1000 Genomes superpopulations are plotted at time 0. Area of points scale with number of SNPs genotyped in the individual.

