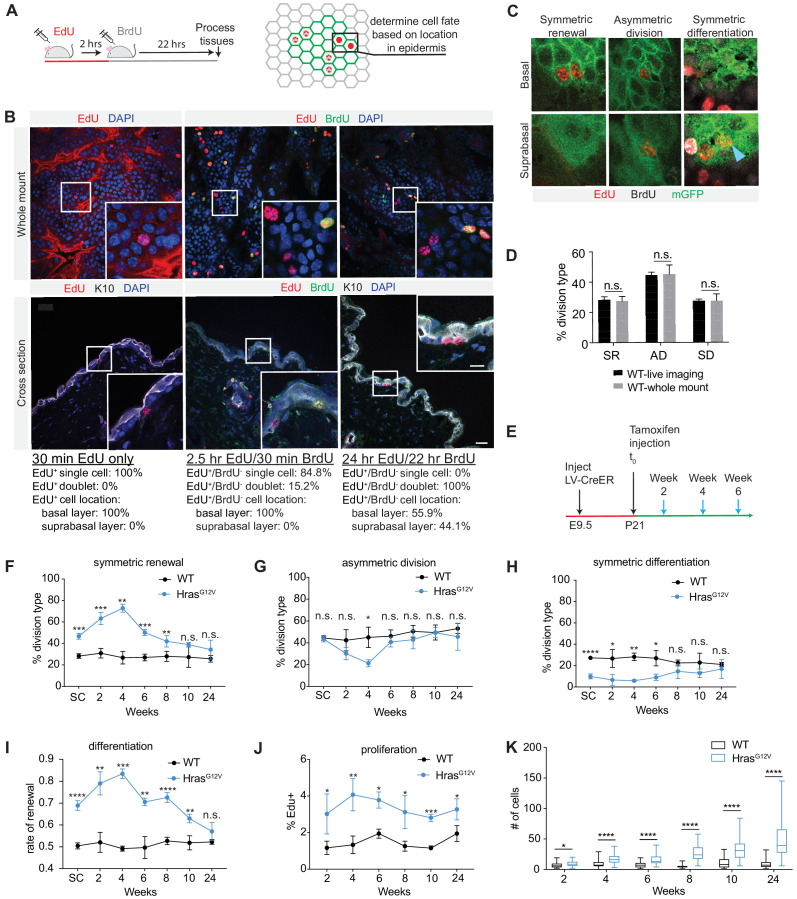
Figure 2. Cell fate identification (CFI) assay reveals dynamic changes in progenitor renewal in expanding HrasG12V clones.
(A) Schematic of CFI assay. EdU-only cells are assessed for location in epidermis (basal or suprabasal layer) as indicator of cell fate choice. (B) Representative images of tissues stained for EdU and BrdU expression, 30 min, 2.5 hr, and 24 hr post-EdU injection. Cells at the 24 hr time point are fully committed to progenitor or differentiated fate. Scale bar is 25 µm. Inset scale bar is 10 µm. At least 2000 total cells were counted per animal. n ≥ 2 animals per time point. (C) Representative images of cell divisions as seen in CFI assay. Blue arrow marks symmetric differentiation division. (D) Cell fate choices scored by CFI assay are not significantly different from cell fate choices scored via intravital imaging. At least 50 cells were scored per animal. n ≥ 3 animals per condition. (E) Schematic of clone activation. Tissues were processed in 2-week intervals following tamoxifen injection (blue arrows). (F–H) Division choices of progenitor cells in activated clones. At least 30 divisions were counted per animal. n ≥ 3 animals per condition. (I) Rate of renewal in HrasG12V and WT clones initially differs significantly, but as HrasG12V clones reach 24 weeks, renewal rates drop to near-homeostatic levels. More than 30 total cells were counted per animal. n ≥ 3 animals per condition. (J) EdU-incorporation over 2 hr in WT and HrasG12V epidermis. At least 300 cells were counted per animal. n = 3 animals per condition. (K) HrasG12V clones expand significantly over time. At least 25 clones were counted per animal. n ≥ 3 animals per condition. For (F–K), the center point represents the mean; errors bars represent the s.d. Two-tailed Student’s t-test was used. n.s. denotes p value > 0.05; * denotes p value < 0.05; ** denotes p value < 0.01; *** denotes p value < 0.001; **** denotes p value < 0.0001.

