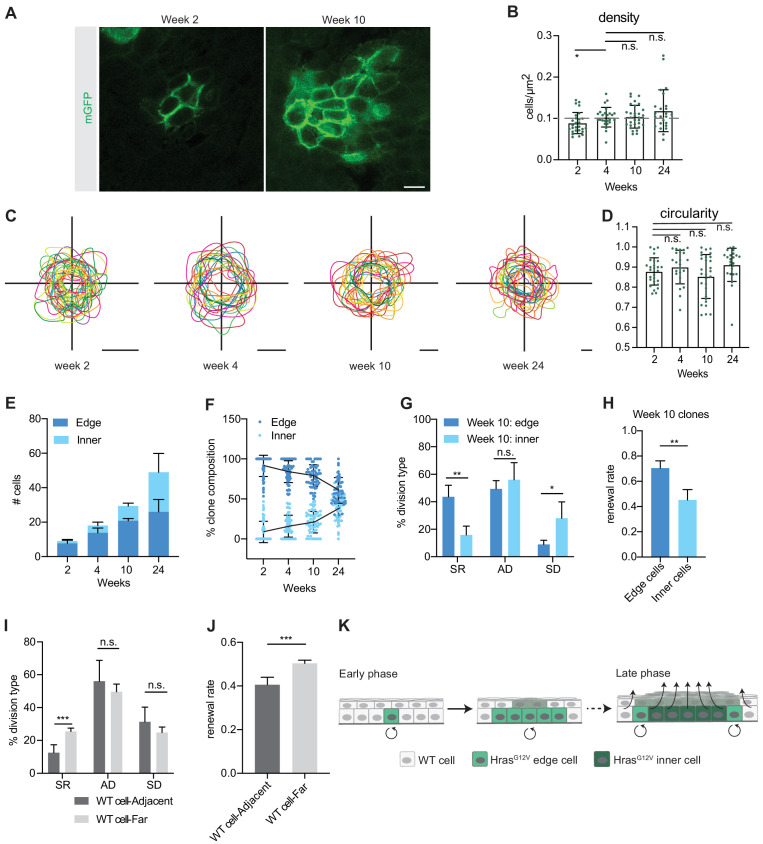
Figure 3. HrasG12V clones develop intraclone heterogeneity over time.
(A) Representative images of basal cell population of HrasG12V clones at weeks 2 and 10. Scale bar is 10 µm. (B) Density of individual HrasG12V clones. Dashed gray line represents average density in wild-type (WT) clones. At least 25 clones were counted per animal. n ≥ 2 animals per timepoint. (C) Outlines of individual HrasG12V clones show a circular morphology. Scale bars are 25 µm. (D) Quantification of circularity of individual HrasG12V clones. At least 25 clones were counted per animal. n ≥ 3 animals per timepoint. (E) Quantification of edge cells and inner cells in HrasG12V clones. At least 52 clones were counted per animal. n ≥ 3 animals per time point. (F) Proportion of edge cells in HrasG12V clones decreases as the clone expands. At least 52 clones were counted per animal. n ≥ 3 animals per timepoint. (G) Edge cells undergo significantly more renewing divisions and significantly fewer differentiating divisions compared to inner cells in week 10 HrasG12V clones. A total of 147 divisions were counted. n = 4 animals. (H) Rate of renewal in edge cells and inner cells of week 10 HrasG12V clones. A total of 147 divisions were counted from four animals. (I) WT cells adjacent to an HrasG12V clone undergo significantly fewer renewing divisions compared to a non-adjacent WT cell. A total of 160 divisions were counted. n = 5 animals. (J) The renewal rate of WT cells adjacent to an HrasG12V clone is significantly lower compared to WT cells not located adjacent to an HrasG12V clone. A total of 160 divisions were counted. n = 5 animals. (K) Early phase HrasG12V clones expand. In contrast, the inner region of late phase HrasG12V clones undergo high rates of differentiation, but the clone does not collapse because the edge cells are more renewing and compensate for the inner cells. In response to the high rate of renewal in oncogenic edge cells, the neighboring WT cells undergo a high rate of differentiation. For (B,D) each point represents a single clone. For (B, D–J); the center point represents the mean; errors bars represent the s.d. Two-tailed Student’s t-test was used. n.s. denotes p value > 0.05; * denotes p value < 0.05; ** denotes p value < 0.01; *** denotes p value < 0.001.


