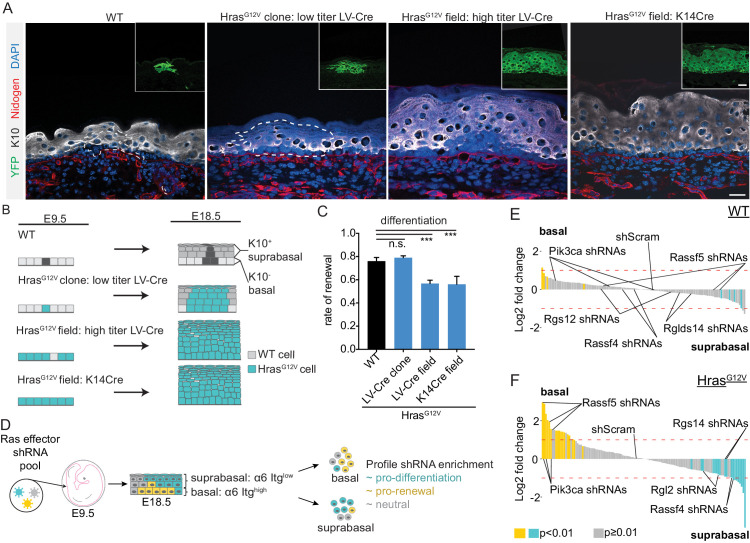
Figure 4. HrasG12V-induced differentiation is replicated in E18.5 epidermis and serves as the basis for in vivo genetic screen.
(A) Representative images of clonal and field activation of HrasG12V in developing epidermis. Scale bar is 25 µm. Inset scale bar is 25 µm. (B) HrasG12V expression can be induced with LV-Cre (high or low titer) or K14-Cre. Changes in HrasG12V expression yield differences in tissue hyperplasia. (C) Rate of renewal decreases in tissues which broadly express HrasG12V (LV-Cre field and K14Cre field). At least 75 cells were counted from each animal per genotype. n ≥ 3 animals. (D) Diagram of shRNA screen methodology. A lentiviral pool targeting Ras effectors was injected into E9.5 embryos. The epidermis was harvested at E18.5, digested into single cells and separated by FACS based on low or high expression of α6 Itg. Each population was profiled for shRNA enrichment. (E,F) Needle plots of shRNA’s enriched in basal layer compared to suprabasal layer in wild-type (WT) and HrasG12V epidermis. shRNAs that are enriched in basal layer (α6 Itghigh population) relative to suprabasal layer (α6 Itglow population) inhibit differentiation. The indicated shRNAs are candidate (Rassf5) or validated (Pik3ca) regulators of HrasG12V-induced differentiation in addition to potential positive regulators of renewal in HrasG12V epidermis (Rassf4, Rgl2, Rgs14). n ≥ 3 animals per genotype. For (C), the center point represents the mean; errors bars represent the s.d. Two-tailed Student’s t-test was used. n.s. denotes p value > 0.5, *** denotes p value < 0.001.

