. 2020 Dec 21;9:e62876. doi: 10.7554/eLife.62876

Figure 3. KIF21B induces microtubule (MT) pausing and catastrophes in T cells.

(A) Live imaging of indicated Jurkat KIF21B-KO T cells stably overexpressing KIF21B-GFP on Lab-Tek chambered coverglass with immobilized anti-CD3. Images show a single movie frame and a maximum intensity projection of a background-subtracted movie. Zoomed areas are indicated (orange), and the kinesin track corresponding to the kymograph shown is indicated with red arrowheads. (B) Frequency distribution of KIF21B-GFP velocity in cells measured from data obtained imaging of KIF21B-KO #2 Jurkat T cell line stably overexpressing KIF21B-GFP on a TIRF microscope at 10 fps. Velocities were measured by kymograph analysis and the numbers were fitted to a Gaussian (red curve). n = 464 events from 102 cells from four independent experiments. (C) Histograms (dots) of peak-fitted fluorescence intensities of monomeric GFP immobilized on glass (green dots) and KIF21B-GFP motors imaged in Jurkat T cells (blue/orange) in two separate chambers on the same coverslip and the corresponding lognormal fits (solid lines). Imaging conditions were identical for both samples. KIF21B-GFP intensity values were corrected for a 50 and 75 nm distance from the coverslip, as illustrated in Figure 3—figure supplement 1B. n = 2601 (GFP) and n = 16523 (6 cells) (KIF21B-GFP) molecules. Mean values relative to monomeric GFP are indicated in the plot. (D–I) Live-cell imaging of KIF21B-KO #2 Jurkat T cell line stably overexpressing KIF21B-GFP and transiently overexpressing EB3-mCherry to label growing MT plus ends. Cells were added on Lab-Tek chambered coverglass with immobilized anti-CD3 and imaged on a TIRF microscope at 10 fps. (D) Kymographs illustrating KIF21B-GFP motors switching from walking to a pausing state. Growing MTs are visualized by EB3-mCherry overexpression. Examples show a growing plus end that undergoes pausing after KIF21B-GFP arrival followed by a catastrophe event (left), or growth re-initiation when the pausing KIF21B-GFP dissociates (middle). Some plus ends are not affected by the KIF21B-GFP motor pause event (right). (E) Kymograph illustrating a KIF21B-GFP tip-tracking on a growing EB3-mCherry plus end followed by a pausing event of both KIF21B-GFP and the MT plus end. (F) Kymograph illustrating two KIF21B-GFP motors reaching a growing EB3-mCherry plus-end causing the motors to dissociate from the MT plus-end, which continues growing, though EB3-mCherry signal is reduced. (G) Quantification of KIF21B-GFP fates observed when a moving KIF21B motor reaches an EB3-mCherry-labeled MT plus end, as illustrated in D-F. n = 224 events from two independent experiments. (H) Quantification of MT plus-end fates when a KIF21B-GFP motor reaches a growing EB3-mCherry-labeled MT plus end and transitions to a paused state, as illustrated in D-F, Figure 3—figure supplement 1C. n = 149 events from two independent experiments. (I) Quantification of pause duration of KIF21B-GFP and EB3-mCherry-labeled MT plus ends, illustrated in G-H. n = 144 and 75 events from two independent experiments.

Figure 3—source data 1. An Excel sheet with numerical data on the quantification of KIF21B-GFP velocities, single-molecule analysis of KIF21B-GFP in Jurkat cells and the effects of single KIF21B-GFP molecules on growing microtubule ends in Jurkat cells represented as frequency distributions (Figure 3B), frequency distributions with lognormal fits (Figure 3C), and as plots (Figure 3G, H and I).
elife-62876-fig3-data1.xlsx (587.5KB, xlsx)

Figure 3.

Figure 3—figure supplement 1. Characterization of KIF21B motility in cells.

Figure 3—figure supplement 1.

(A) Workflow for GFP (monomer reference) and KIF21B-GFP single-molecule counting. Imaging was performed in a dual-chamber microscope slide in a single imaging session with identical microscope settings. Monomeric GFP was expressed in HEK293T cells and lysates were diluted in PBS to single-molecule densities in the first chamber. KIF21B-KO #2 Jurkat T cell line with stable overexpression of KIF21B-GFP were added to the second chamber, which was coated with anti-CD3 antibodies. Single molecules were detected using DoM ImageJ plugin and for KIF21B-GFP motors in cells, single molecules were only analyzed from kinesin tracks with a duration of >1 s. (B) Lognormal fits of peak-fitted fluorescence intensities of monomeric GFP immobilized on glass (green dots) and KIF21B-GFP motors imaged in Jurkat T cells corrected for a hypothetical range of distances between molecule and coverslip. The evanescent field decays exponentially and KIF21B-GFP fluorescence is corrected for that given the TIRF laser angle was fixed at a penetration depth d of 180 nm. (C) Kymograph illustrating KIF21B-GFP motors switching from walking to a pausing state. Growing microtubule (MT) end is visualized with EB3-mCherry. A static plus end undergoes a catastrophe after a KIF21B-GFP pausing event (right). (D) Quantification of MT plus-end state when a KIF21B-GFP motor reaches the EB3-mCherry-labeled MT plus end and transitions to a paused state, as illustrated in Figure 3D and C. Numbers relate to the ‘Pausing’ and ‘Tip-tracking + pausing’ category of Figure 3G. n = 149 events from two independent experiments. (E) Kymographs illustrating a KIF21B-GFP motor reaching a growing EB3-mCherry MT plus end where motor dissociation from the MT coincides with MT pausing (left) or a catastrophe event (right). (F) Quantification of MT plus-end fate when a KIF21B-GFP motor reaches a growing EB3-mCherry-labeled plus end and dissociates, as illustrated in Figure 3F, E. n = 75 events from two independent experiments. (G) Kymograph illustrating a KIF21B-GFP motor directly associating to an EB3-mCherry-labeled growing MT plus end and affecting MT growth until KIF21B-GFP dissociates.
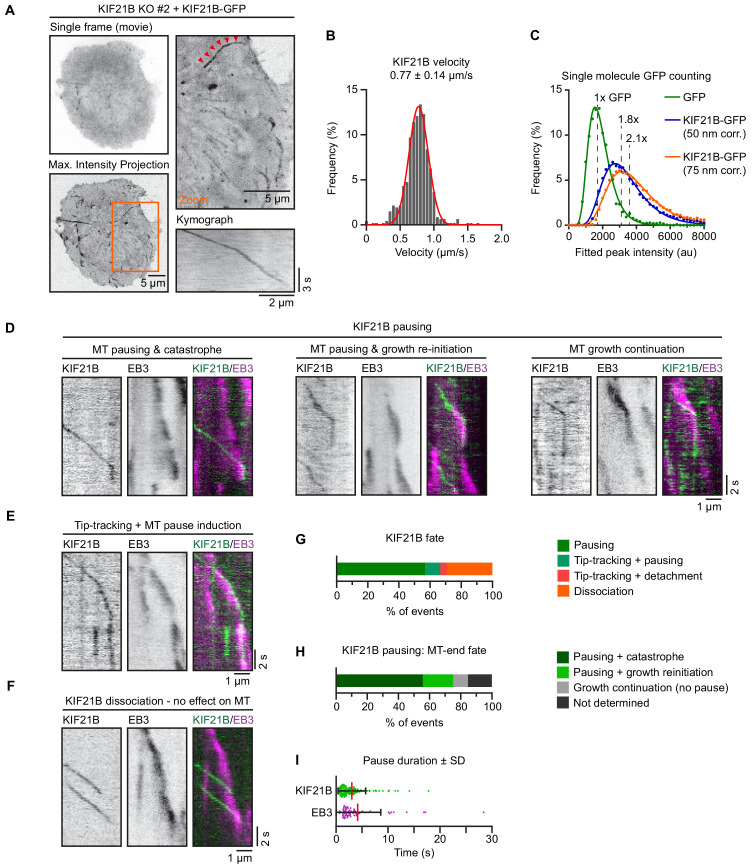
Figure 3—figure supplement 1—source data 1. An Excel sheet with numerical data on the quantification of single-molecule analysis of KIF21B-GFP in Jurkat cells and the effects of single KIF21B-GFP molecules on growing microtubule ends in Jurkat cells represented as a lognormal data fit (Figure 3—figure supplement 1B) and as plots (Figure 3—figure supplement 1B and F).
Figure 3—video 1. KIF21B-GFP motors imaged at the immunological synapse of an activated Jurkat T cell.
Download video file (5.8MB, mp4)
Live imaging of a Jurkat KIF21B-KO T cell (KO #2) stably overexpressing KIF21B-GFP. Video corresponds to Figure 3A. Images were collected using a TIRF microscope at 10 frames per second. Video is sped up two times to 20 frames per sec. Time is shown in seconds.