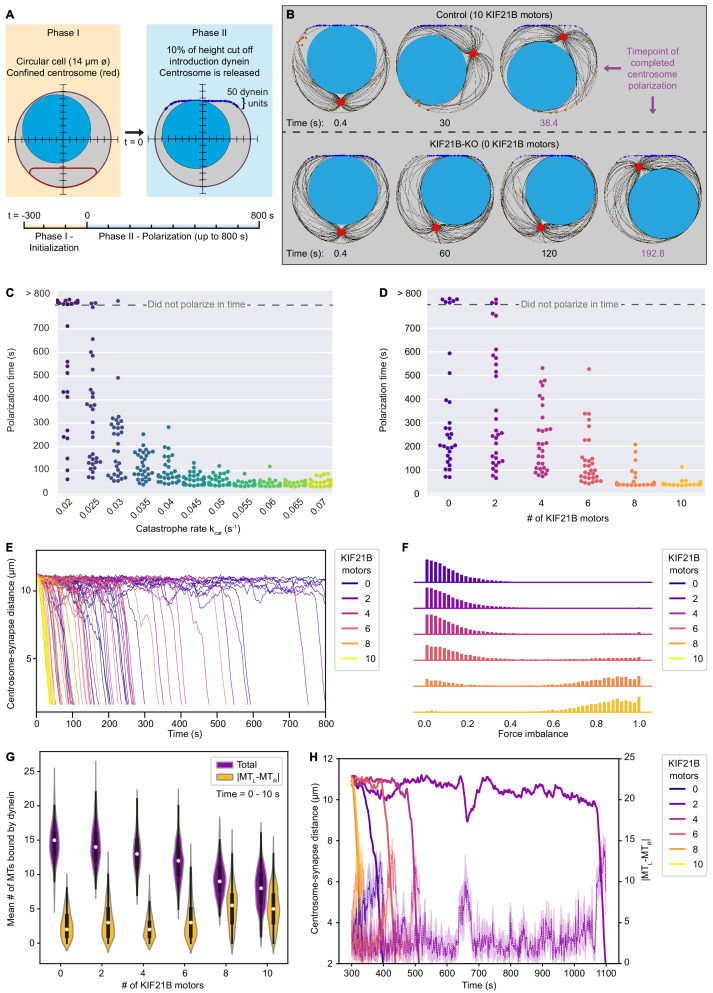
Figure 6. KIF21B prevents centrosome stalling induced by force balance during polarization by limiting MT length.
(A) The T cell model is initialized to a steady state MT network in 300 s (Phase I) and is then extended to a polarizing model (Phase II). In this transition, the cell shape is changed to include a flat side with curved corners with 50 dynein units attached, and the centrosome confinement (red) is released to allow centrosome movement and translocation. (B) Snapshots of modeled T cells during centrosome polarization in the KIF21B-pausing model with the presence of 10 (top row) or 0 (bottom row) KIF21B motors. The simulations were stopped after the centrosomes reached a polarized position <2.5 µm away from the synapse. The final snapshot in each row indicates the frame of the simulation when the centrosome was fully polarized. Timepoints are indicated below each snapshot. (C) Quantification of polarization time (the time the centrosome needs in Phase II to reach a polarization position) per simulated cell for the non-pausing model at indicated catastrophe rates. Some cells did not polarize within the maximum simulation time (800 s) as indicated in the upper part of the graph. n = 30 simulated cells per condition. (D) Quantification of polarization time (the time the centrosome needs in Phase II to reach a polarization position) per simulated cell for the KIF21B-pausing model with indicated numbers of KIF21B motors present. Some cells did not polarize within the maximum simulation time (800 s) as indicated in the upper part of the graph. n = 30 simulated cells per condition. (E) Trajectories showing the centrosome-synapse distance during Phase II over time along the vertical axis of the simulated T cell. Trajectories are color coded for the number of KIF21B motors present (see legend). Shown are 15 runs per condition. (F) Quantification of force imbalance within the KIF21B-pausing model. Force imbalance is calculated from the forces experienced by dynein at a given time point, projected on the horizontal axis. Force imbalance was characterized as the absolute difference of projected forces pointing to the left and forces pointing to the right, normalized by the sum of all forces. This quantity is determined for each timestep between 0 and the polarization time for every repeat and binned to create the according histogram. Histograms are color coded for the number of KIF21B motors present in the simulation (see legend). n = 30 simulated cells per condition. (G) Quantification of the mean number of MTs that are bound by dynein to the synapse within the KIF21B-pausing model. Violin plot distributions show the total number of MTs bound (purple), and the absolute difference (|MTL-MTR|, yellow) between the number of MTs bound on the right versus left side of the cell’s vertical axis. Within each violin, a boxplot indicates the quartiles (black) with the inner quartile range (25–75%) indicated with the thickened region. Median values are indicated for each violin (white dot). Values were obtained in the first 10 s of Phase II of each simulation. n = 30 simulated cells per condition. (H) Trajectories of centrosome-synapse distance over time (solid lines) plotted together with trajectories of the absolute difference |MTL-MTR| between the number of MT bound to dynein and passing the nucleus on the left or on the right (dashed lines) in the same color for the corresponding runs. To make the |MTL-MTR| more legible, the mean and 95% confidence interval is plotted averaged over three frames (1.2 s). Trajectories are color coded for the number of KIF21B motors present in the simulation (see legend).


